Take control of your ARR
Abbey Lauren Minondo | | 4 min read
Annual Recurring Revenue (ARR) is our north star metric at Equals. Calculating ARR from Stripe using SQL can be quite a journey, but it’s worth it for the reporting flexibility. Here’s how to take control of arguably your most critical KPI, in a few simple steps.
Ready to get started? Connect to Stripe and try our template today.
🧭 Go beyond Stripe’s dashboards
If you’re a curious analyst at 💜, you’re going to want to dig deeper than the dashboard visuals Stripe churns out for you. While these snapshots are great for a quick pulse on how your company is doing, slicing and dicing this information isn’t possible from the Stripe UI. That’s why Stripe Sigma was invented: it’s a product owned by Stripe that will allow you to write SQL queries against your data.
Awesome – you’re all set, right? Not so fast. While Sigma has templates available to help you with your queries, there’s no Monthly Recurring Revenue (MRR) query prewritten for you and there’s a 24 hour lag in the data that you can query from. Plus, if you want to go beyond the raw output and build a cohort analysis, you’re going to end up downloading the results of your query as a CSV and then copy-pasting into a spreadsheet. Again and again. That’s why we built a connection to Stripe that allows you to write queries against live data and set the output to auto-update your spreadsheet models.
🔍 Why this is hard to do
Along comes Equals: the perfect tool for querying real-time Stripe data and flexible enough to build models. So why is ARR (and MRR) reporting still complicated? 🤯
Stripe doesn’t provide a template for MRR calculations because, by default, subscription history is not something that is available via their API. Building a query to report back historical information, thus, necessitates relying on invoice information in lieu of subscription details.
Note: we’ll release an updated version of this query based on the subscription table if you’ve enabled this reporting.
⌨️ How to query from Stripe in Equals
We’ve done the leg-work for you. The ARR Build template in Equals has a data sheet that will immediately pull from your company’s information all of the needed information in order to recreate your Stripe reports. All you have to do is customize the query to bring in additional information relevant to your business: like segmentation based on location or plan type.
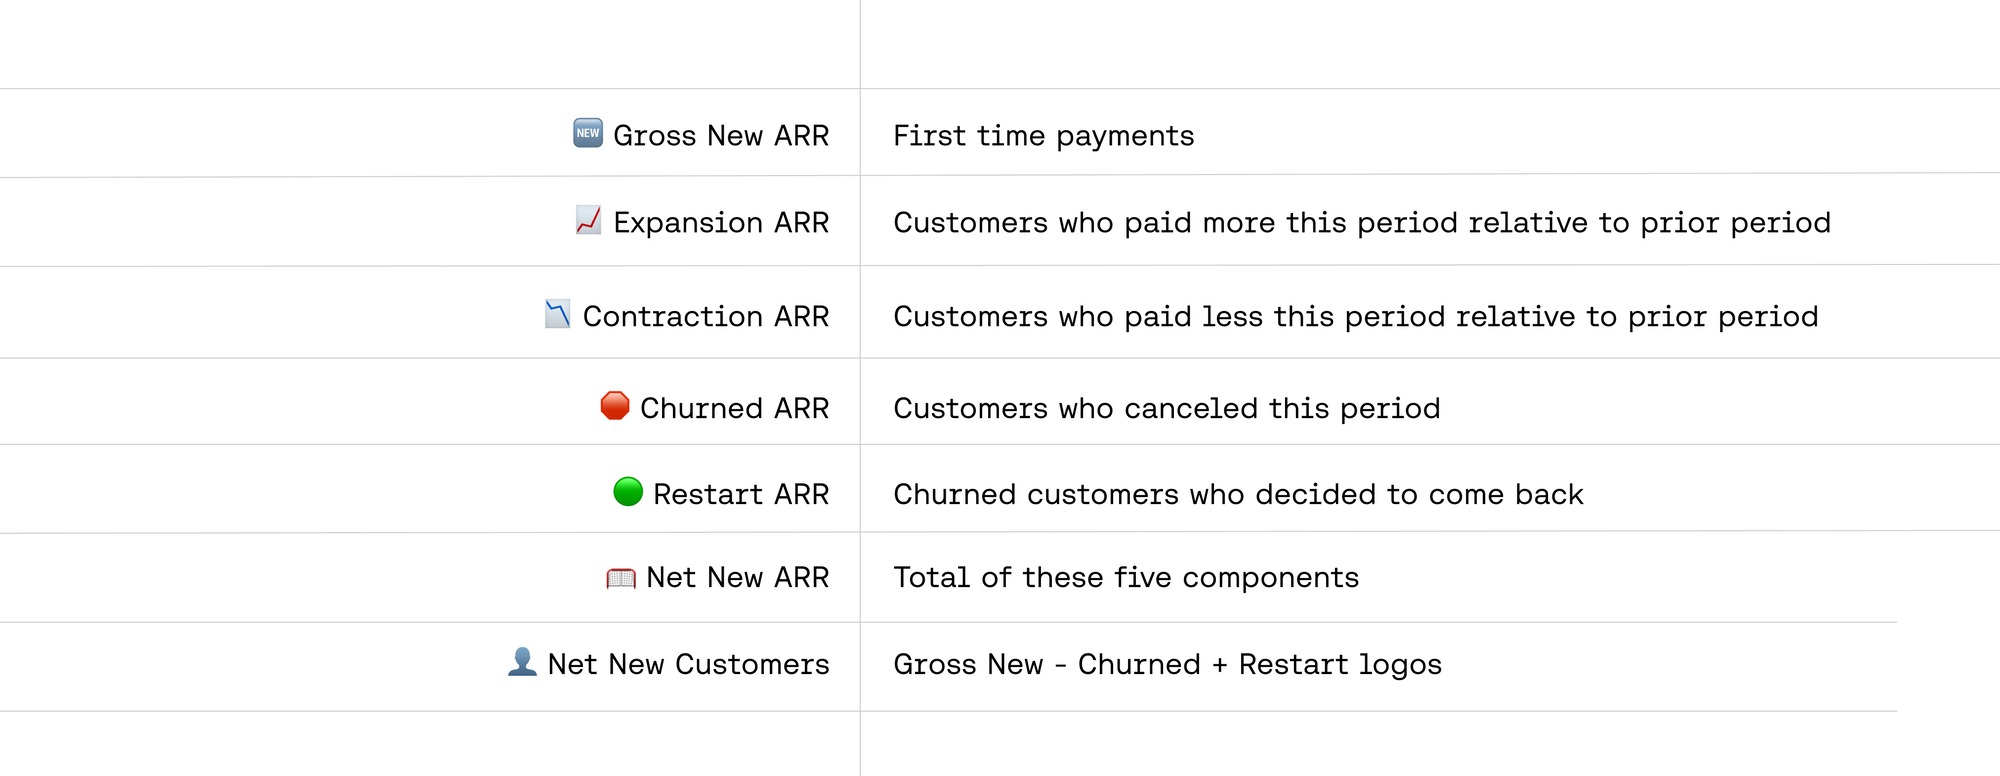
This query is particularly useful because it makes the spreadsheeting very simple! Notice how each transaction is displayed as a line item in your workbook and breaks down revenue into five components: new, expansion, contraction, churn, and restart.
💰 What to think about when reporting on MRR
Now that you have the raw data to work with… let’s get back to MRR. This metric is most relevant for businesses with primarily monthly contracts. MRR multiplied by 12 gives you a good proxy for ARR (annual recurring revenue). Typically, SaaS businesses look at ARR for two reasons. First, because customers are billed on a recurring basis and it's assumed they will remain customers into the future. Second, for high-growth companies, annualizing today's billings will give you a better picture of future revenue since you're likely adding more customers each month and your existing customers are increasing their spend on the platform.
An ARR build is a good high level summary of your business – it helps you show how much you’re growing in tangible ($) terms. But it’s also dangerous to just look at your build! Changes you make to your business that might negatively or positively impact any of the expansion, contraction, churn dynamics may take months to propagate through your build.
✋ Don’t skip the cohort report
Cohorted reporting (or cohort analysis) is a great way of better understanding the levers that affect your revenue and help you get ahead of things, faster. Imagine breaking a part of your activation flow in a way that leads to a much higher churn rate in the second month for new customers. You might not see that come through in your overall gross churn rate for a few months, at which point you’ve lost customers and revenue (more on the importance of defense as a growth strategy). That’s why we turn to cohort reports.
Cohort reports are usually set up so that the first column is by billing month. This will help you answer questions like: “what is your retention at month 3, month 6, month 12?” (every column will answer that question).
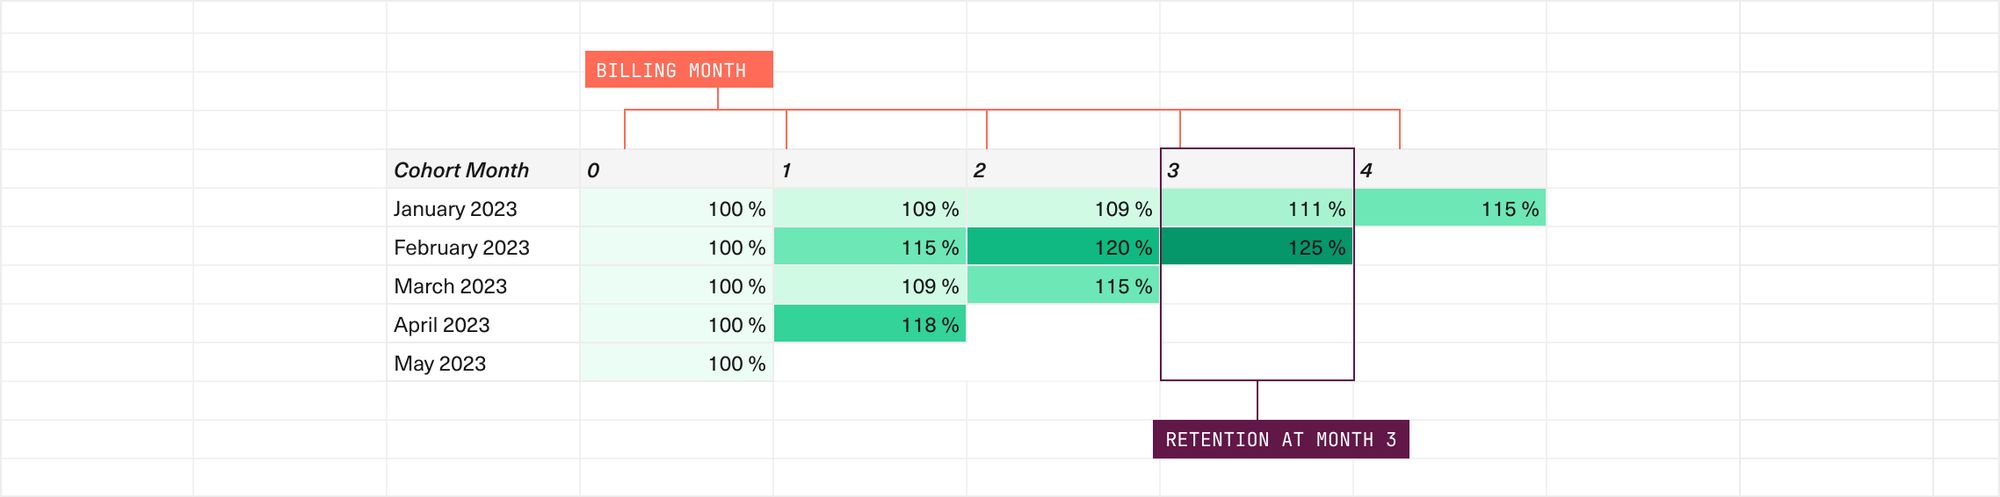
Looking at the Net Revenue Retention (NRR) percentages, you can quickly diagnose changes that impact your entire customer base, regardless of their maturity. This will help you identify breakpoints across changes you make (for example: issues in signup flow, new pricing, changing the way your sales team sells). Looking at a cohort analysis will give you a much better picture into your customer journey and how retention evolves as someone continues with you.
Finally, you can use these models to compare your retention to benchmarks for good and great retention.
💬 Keep the conversation going
There’s no time like the present to get a better grasp on your revenue. Sharpen your SQL skills by using our pre-written query and adjust your views to better identify your highest paying clients or opportunities for upselling.
Try the template today. Reach out if you have questions getting started.

By Abbey Lauren Minondo
Business Operations at Equals
