Sharing the decks we used to raise a $16M Series A
Bobby Pinero | | 4 min read
As a follow up to our last post, today we’re sharing the decks we used to raise our Series A led by Andreessen Horowitz. Our advice: own the narrative. Below, we’ll walk you through what this means to us.
Before diving in, it’s important to underscore that Series A investors typically look for companies that have developed a minimum viable product (MVP) and achieved some level of market validation. We knew it was time for a Series A because we had met initial growth and product milestones and needed to support scaling operations, expanding marketing efforts, and hiring additional talent.
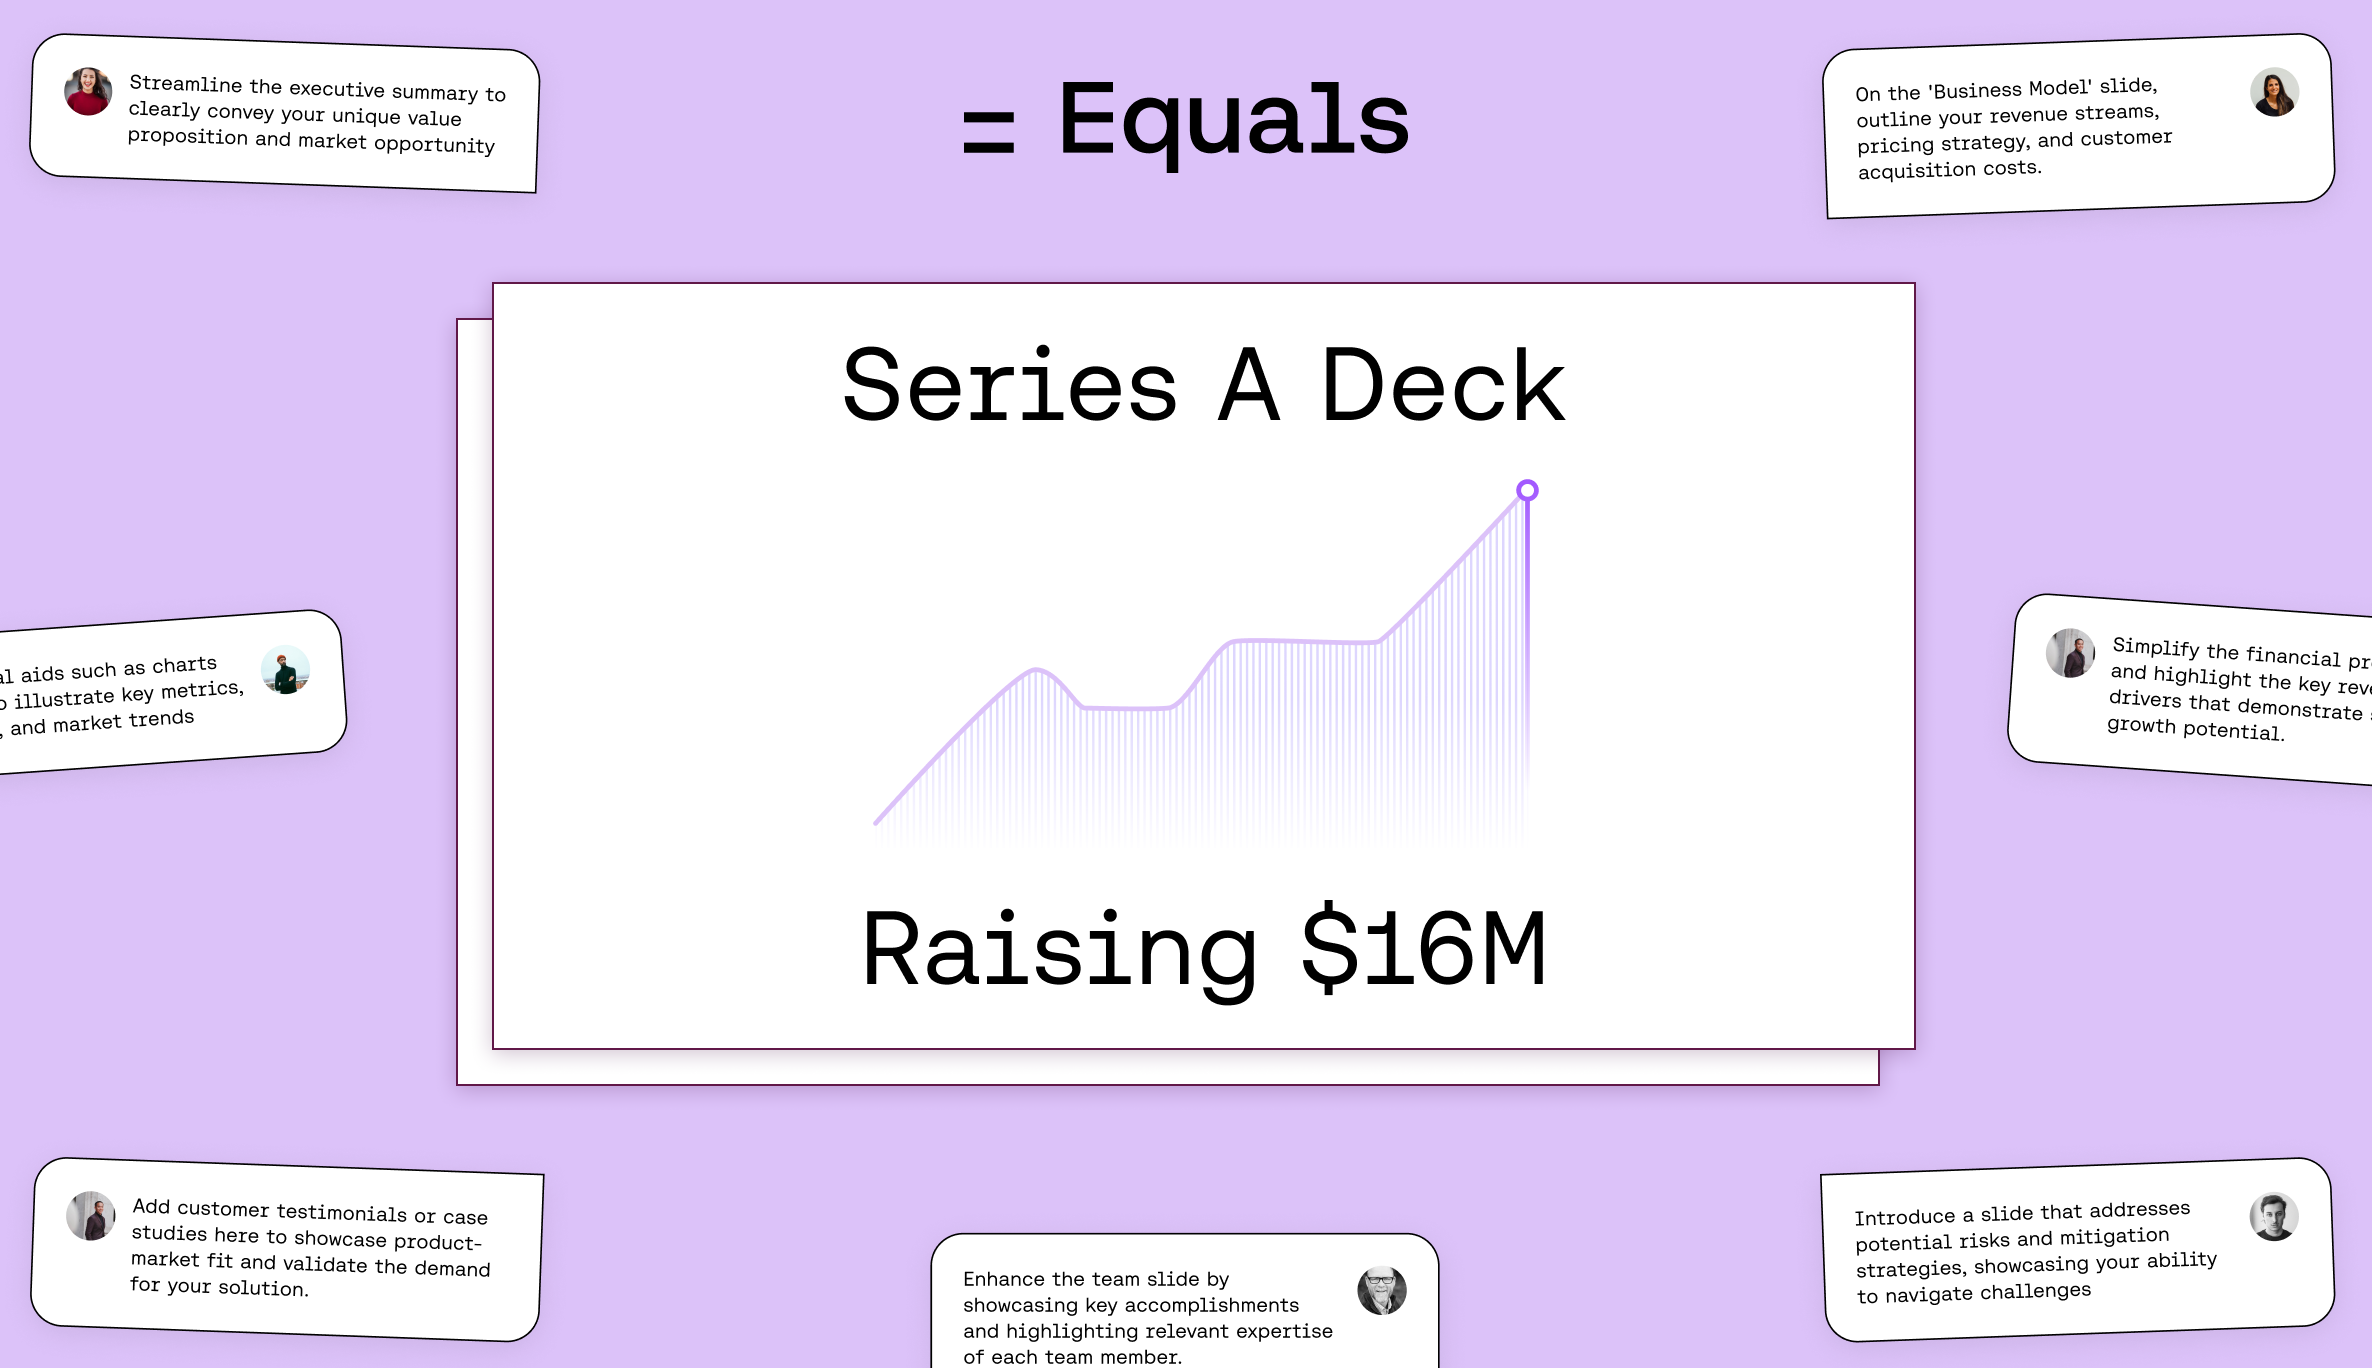
Our approach to raising a Series A started with the creation of two different decks: a pitch deck and a data deck. Your pitch deck is a punchy story about your startup that doesn’t get into all the nitty gritty details about your business. Your data deck, on the other hand, tells that story in numbers and allows you to dive into business drivers in detail. If you master both, you can set the tone of the conversation rather than react to questions.
The Role of a Pitch Deck:
Our pitch decks focus on what we call the three P’s (problem, product, people – see more in our Seed post).
Problem: Reiterate the core problem you’re solving. In our case, we noted how alternatives tried to improve areas where the spreadsheet has failed to innovate. But none had been able to replace the spreadsheet’s ubiquity in business. Our fundamental belief is that the spreadsheet is still the best way to do analysis, it just needs to be modernized. In our pitch deck, we drew upon real-life examples from our experiences working in spreadsheets to “show not tell”, underscoring the breadth of the problem in tangible terms.
Product: This is the time to shine: show what you’ve built so far, the traction gained, and how you’ll continue to build towards your vision. In our case, we highlighted how we had built everything we planned in our Seed raise, and demonstrated how this MVP set of features worked together to solve the problem and fuel early adoption with customers.
In the spirit of “showing and not telling”, pair qualitative quotes from clients already enjoying your product with quantitative reports on how your business has grown (logos, ARR). Show how your customers are using and getting value out of your product in their own words.
Looking forward, demonstrate your approach to prioritizing and sequencing the roadmap to ensure you'll get there with the resources your investors provide. And then, paint a rich picture of all the things that are yet to be built. Create a sense of momentum – this is just the tip of the iceberg for what you have in store.
People: Emphasize why you’re the best equipped team to take on this problem. Walk through the investments you’ll be making in your team in order to achieve what you intend to do with your product.
Download our Series A pitch deck.
You’re not done quite yet – we recommend having a data deck in addition to your pitch deck if you want to stand out in the fundraising process.
The Role of a Data Deck:
The data deck provides the opportunity to delve deeper into your company's fundamentals. It’s important not to overload your audience with unnecessary data points. Whittle your deck down to the “hero” data points that contribute to the overall narrative of your startup. Ensure that each graph is understandable at a glance, with a clear takeaway and sufficient context on how you’re defining each metric. Disclaimer: we don’t recommend obfuscating data! Remember that investors get access to all your raw data after the term sheet is signed.
Here’s what we included in our data deck:
Business Overview:
- Customer logo and revenue growth - Start your story with the most important metrics your investors are looking for. If you have revenue, tie it to your business model (e.g., how you make money) so investors have a clear sense for what drives your business.
Customer Acquisition:
- Top of funnel activity, conversion, and active user growth - We wanted to show that our top of funnel was growing and our users were converting at a healthy rate across each step. In other words, demonstrate how your go-to-market motion lets you scale.
- Personas buying our product, average days of activity per customer - Be clear on how your go-to-market motion ties to the personas that your company is targeting and the way they make buying decisions. Highlighting the average days of activity per customer helped us underscore the value customers were getting and provided a leading signal on retention.
Monetization and Retention:
- Net and gross dollar retention, logo retention cohorts (first month cancellations excluded) - Show that your acquisition engine is sustainable, and that the dollars you spend to acquire each customer is translating into revenue.
The next year:
- Revenue path for the next year and how to achieve these goals - Illustrate what it will take to achieve your revenue goals. Be ready to justify your assumptions (e.g., if getting to $5M revenue requires 2x ARPA, is that realistic? Why? What levers will you pull to get there?).
Once you’ve built your data deck, don’t just attach it in an email like an afterthought. Remember: this is your opportunity to own the narrative. Actively walk investors through your deck so that they can better understand your thought process.
Use this as an opportunity to showcase your understanding of your business. Most investors appreciate the opportunity to get a high-level sense for your business drivers and ask you questions about your growth without getting lost in the weeds.
Download our Series A data deck.
Fundraising is a fun time - and definitely a ton of work. When done well, the process forces you to get clear on your narrative. Get started by using our Series A data deck template in Equals, which shows exactly how we built out core business metrics for our fundraising pitch. Good luck!

By Bobby Pinero
CEO and Co-Founder of Equals.
