Exploring Figma's Self Serve Forecast Model
Chris Burgner | | 4 min read
Operator’s Dilemma Series
Every company runs their business through a shortlist of models. Yet all of those models are private and every operator starts from scratch when building theirs.
We're excited to change that today. We're launching a new series to share the models built by the best operators in some of the most exciting businesses in technology, along with their stories.
Figma's Self Serve Forecast
We recently sat down with Sean Whitney of Craft Ventures, Figma’s 40th employee and second Strategic Finance hire, to learn how Figma built a Self Serve forecast model that consistently predicted ARR growth within 5%.

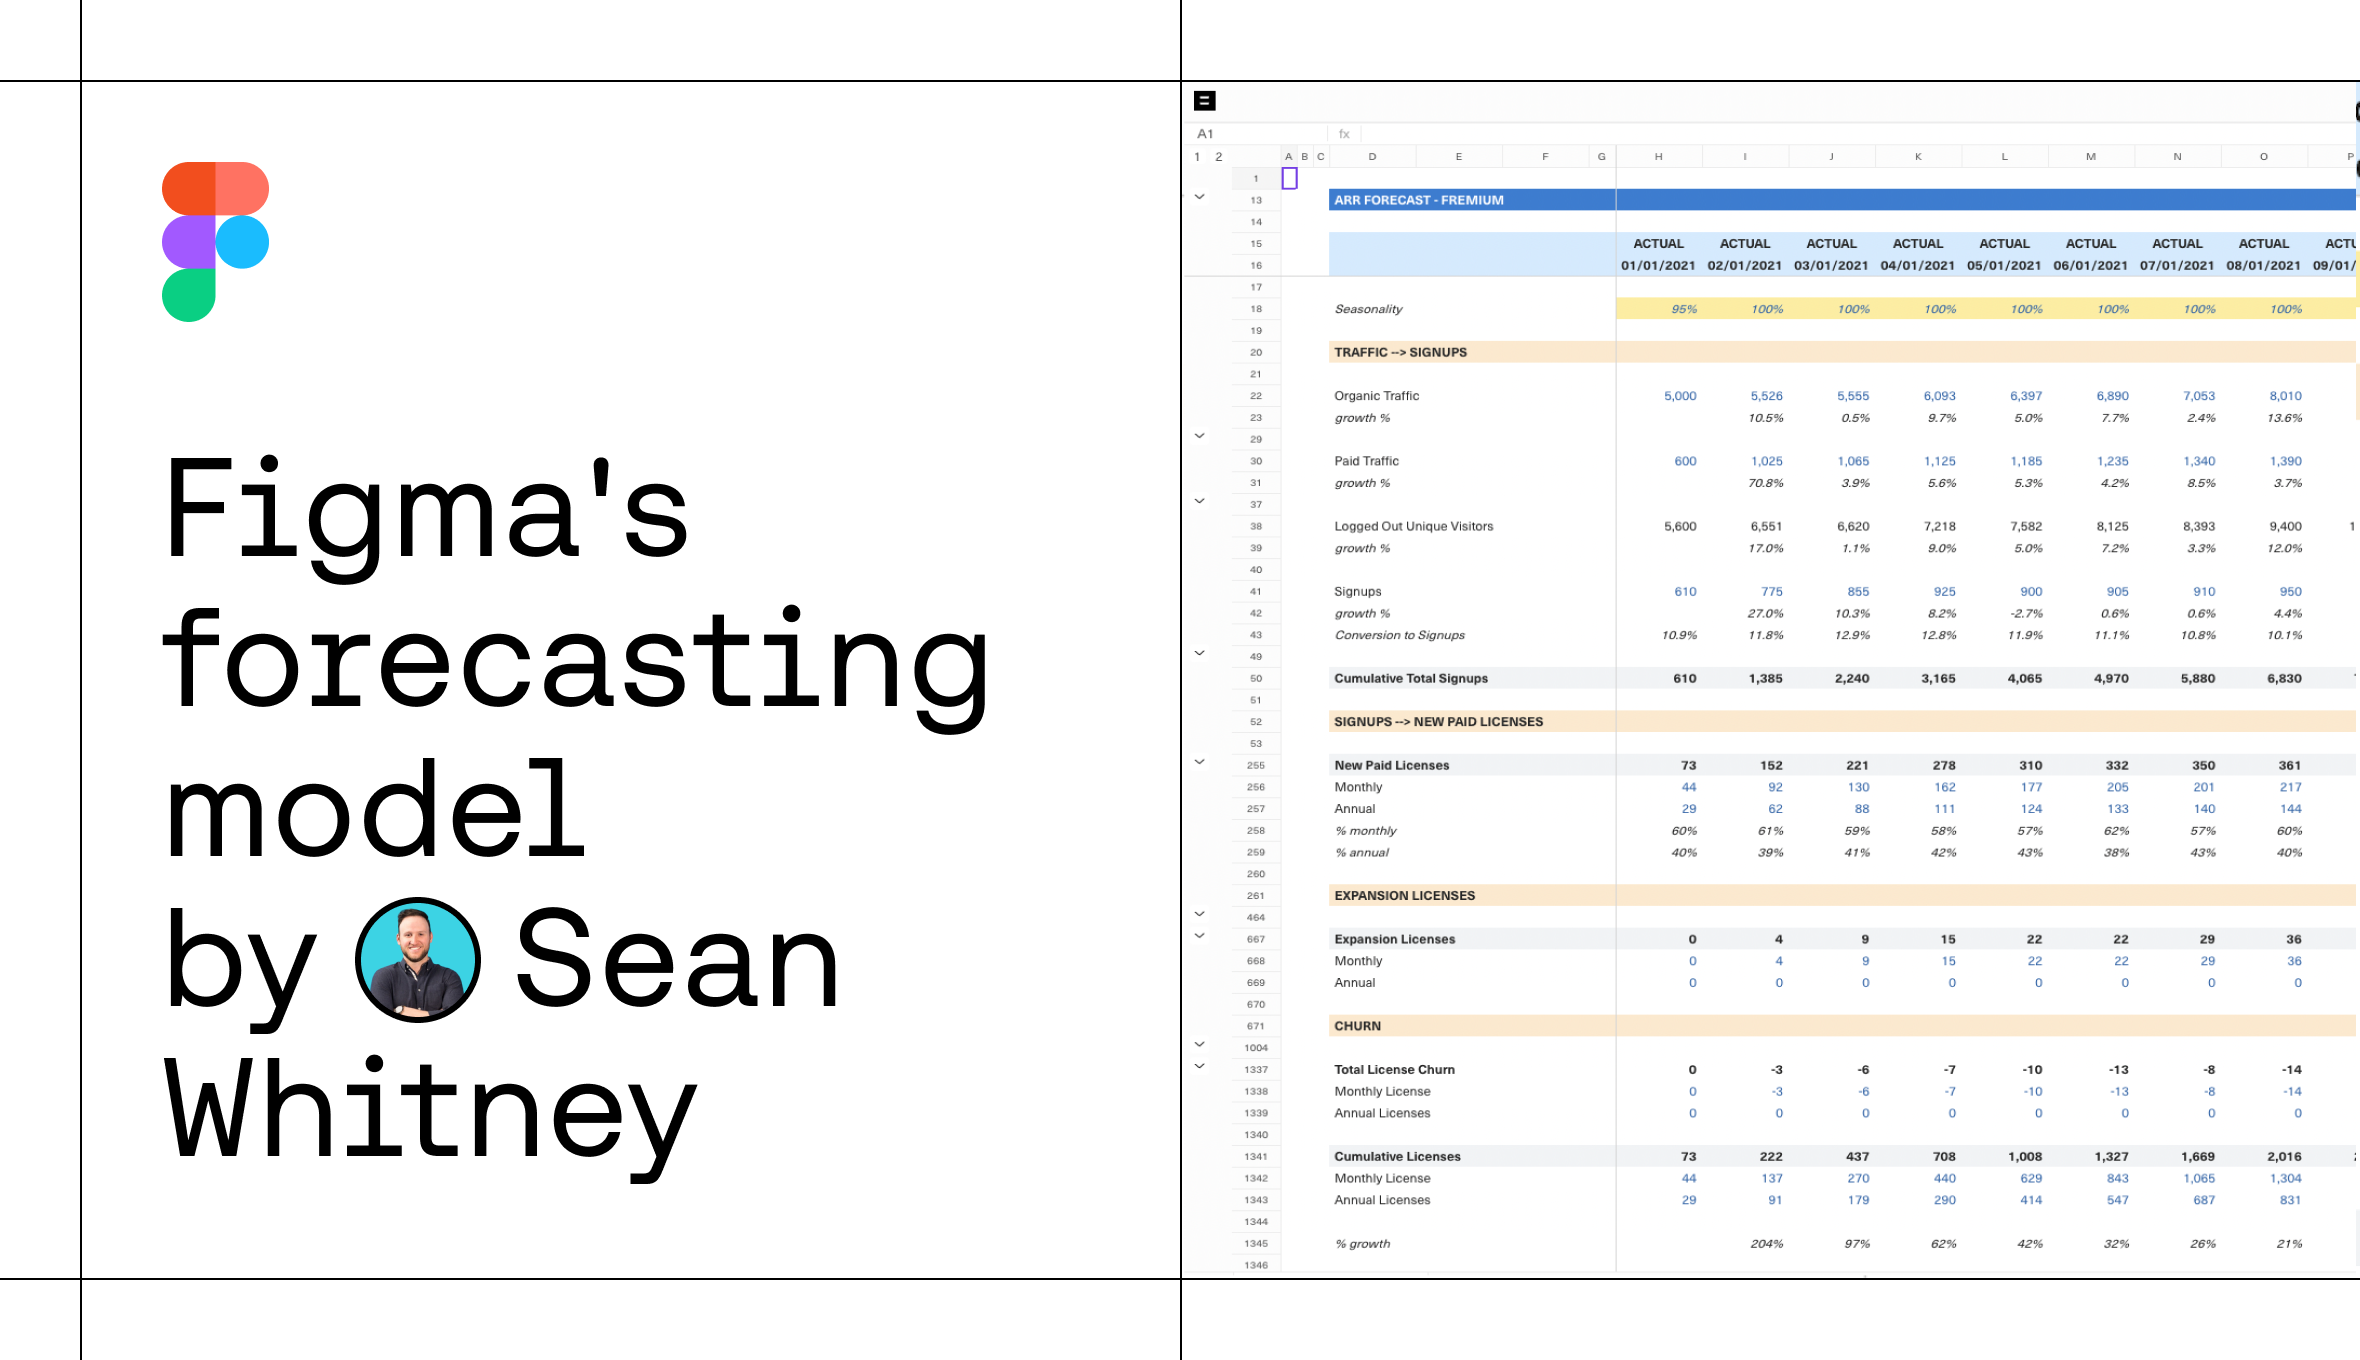
Figma's forecasting model for Self Serve ARR
Figma is a classic bottom-up SaaS business model. In its early days, the company was predominantly selling to customers through a Self Serve motion. That meant the team needed to nail the Self Serve forecast to understand performance at the overall level.
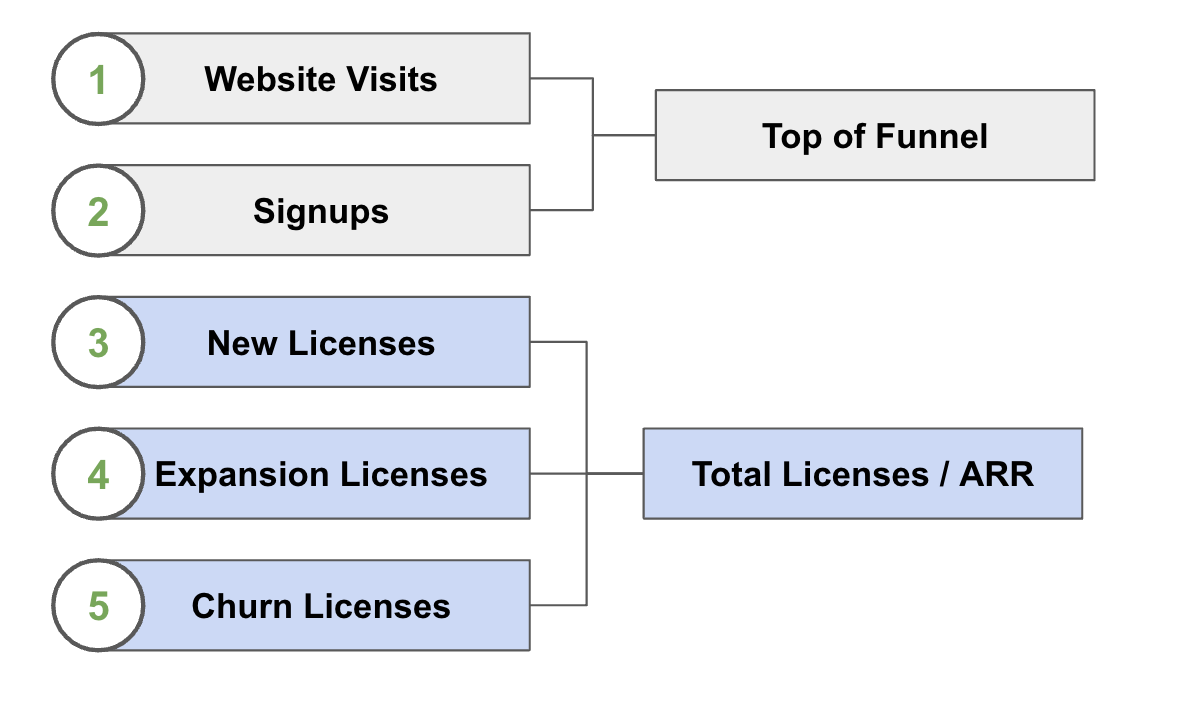
The model Sean’s team built covered the full customer lifecycle and was structured into five parts: Website Traffic and Signups which make up the Top of Funnel (“ToF”), followed by breakouts for New, Expansion and Churn Licenses which equate to Total Licenses and ARR.
We created a Template in Equals, using dummy data, to help companies apply the critical insights from Sean’s experience. Let’s dig in to learn more.
Model Walkthrough
Top of Funnel
Website Traffic
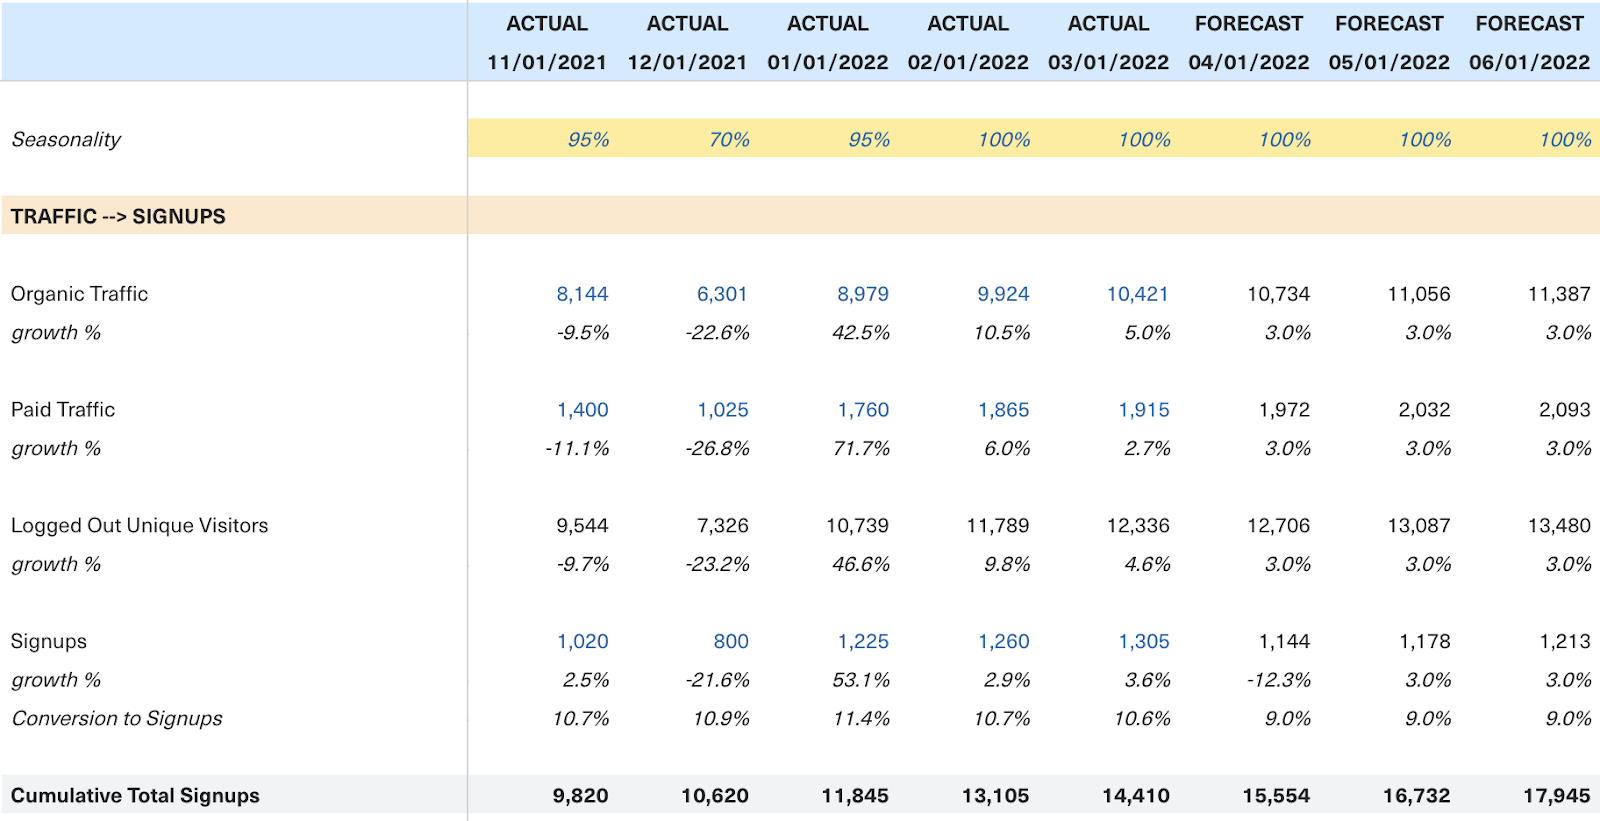
The model starts by segmenting between Organic and Paid Traffic as these sources grow at different rates depending on Marketing investment. Combining Organic and Paid yields Logged Out Unique Visitors or potential Signup volume.
Signups
Signups represent new instances of the product and are a step before New Paid Licenses as Figma offers a Free plan. You can adjust this section to mirror your company’s go-to-market motion.
Website Traffic and Signups constitute the ToF and are the most sensitive drivers of any bottom-up SaaS model. Because of the large volume at this stage, small percentage changes in ToF performance drive outsized impact at the ARR level and lead to forecast error. To help get ahead of this, Sean recommends partnering with your Product and Marketing teams to break ToF volume into more granular levels such as traffic source, campaign or geography.
Bottom of Funnel
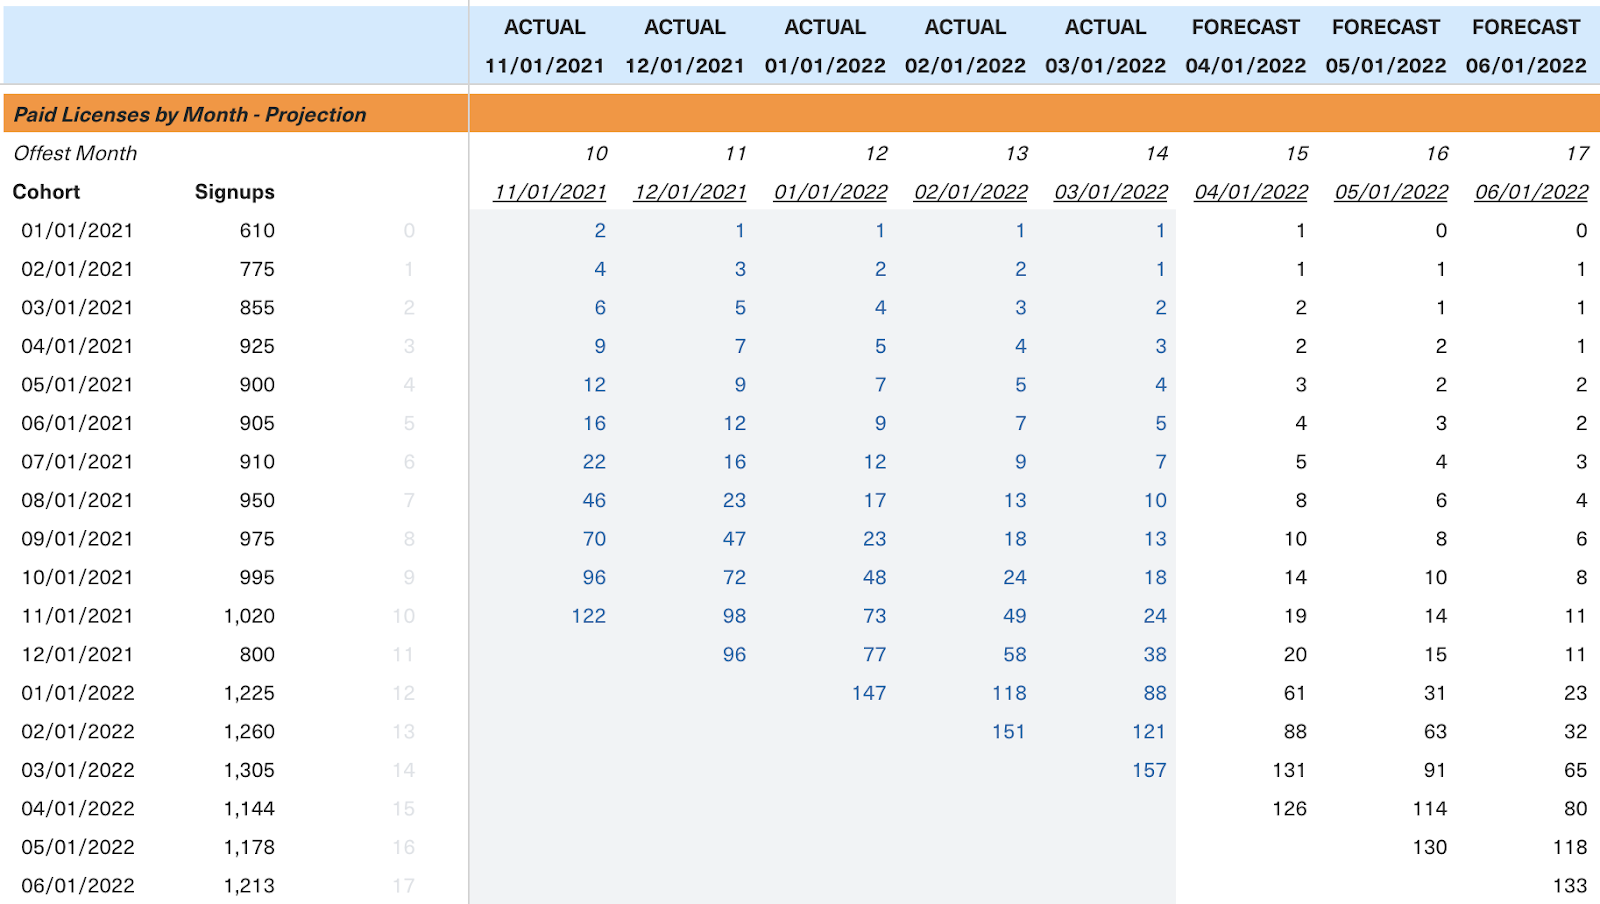
New Licenses
Here we get our first glimpse of the magic powering the model, cohorting. Looking at Bottom of Funnel metrics on a cohorted basis is critical for two primary reasons:
- Conversion rate trends - benchmarking cohorts by age allows users to compare and contrast performance trends as the business evolves
- Volume contribution - creating a waterfall of paid license volume by ToF cohort establishes the link between monetization and funnel aging
The former helps connect the dots between go-to-market experimentation and changes in performance (e.g. pricing model updates, changes in purchase flow).
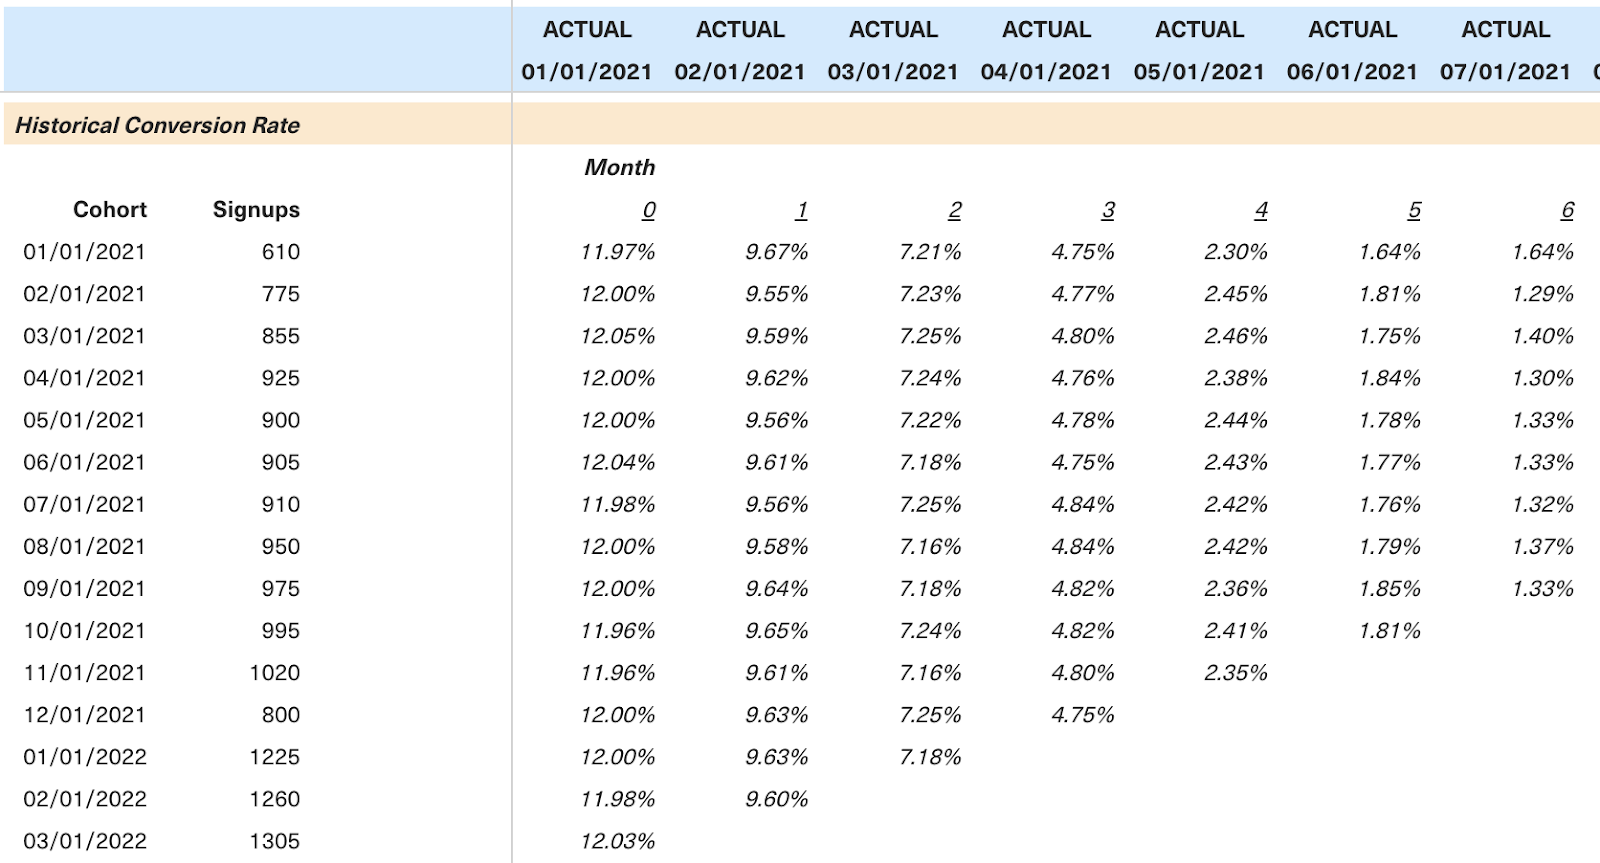
While the latter illustrates that today’s monetization is a lagging metric of ToF activity from the last several months. Freemium tools can monetize users not just at signup but through engagement with the product over time.
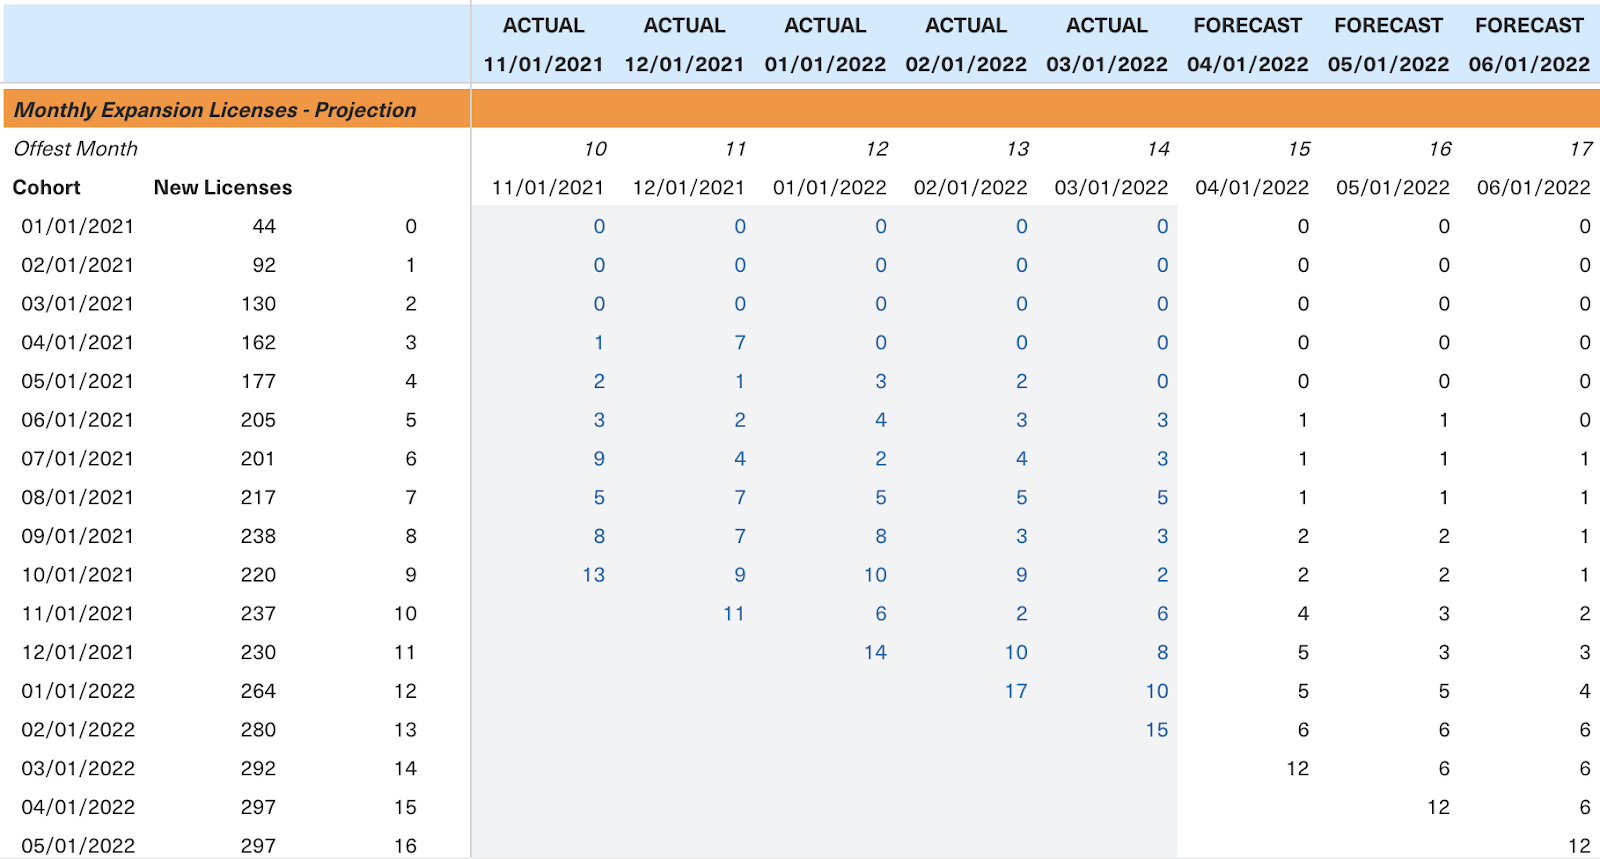
Expansion Licenses
Next, the model lays out how New Signup cohorts add or remove licenses as they age, excluding Churn. Separate breakouts are required for businesses with both month-to-month and annual contract customers as upsells tend to happen in different time increments.
Benchmarked expansion rates inform how upsells will materialize as each cohort ages.
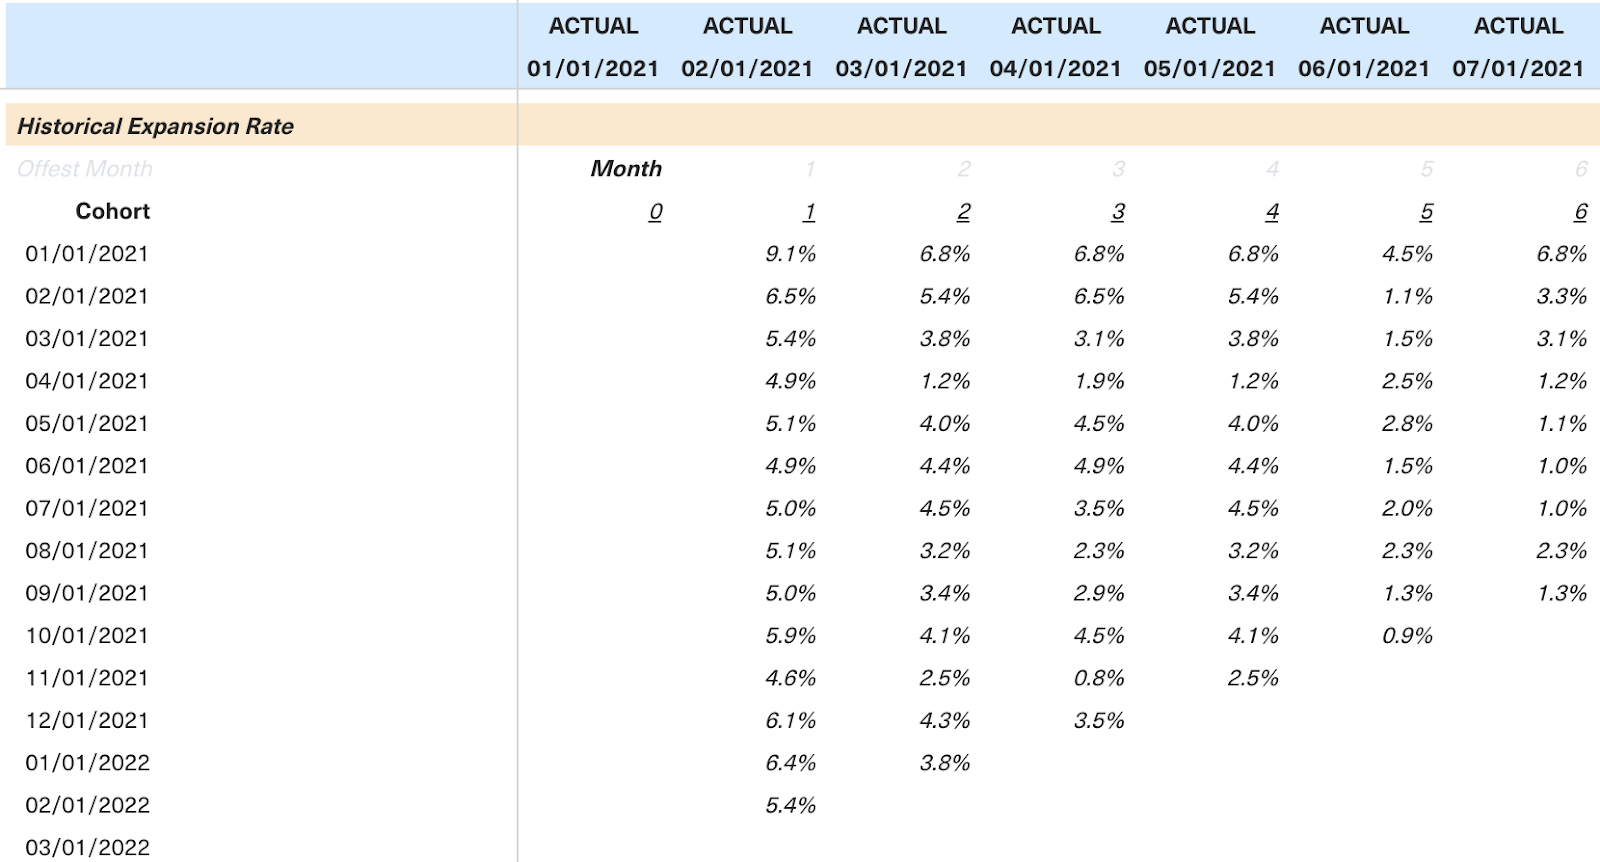
This is then fed into a projected waterfall based on cohort month.
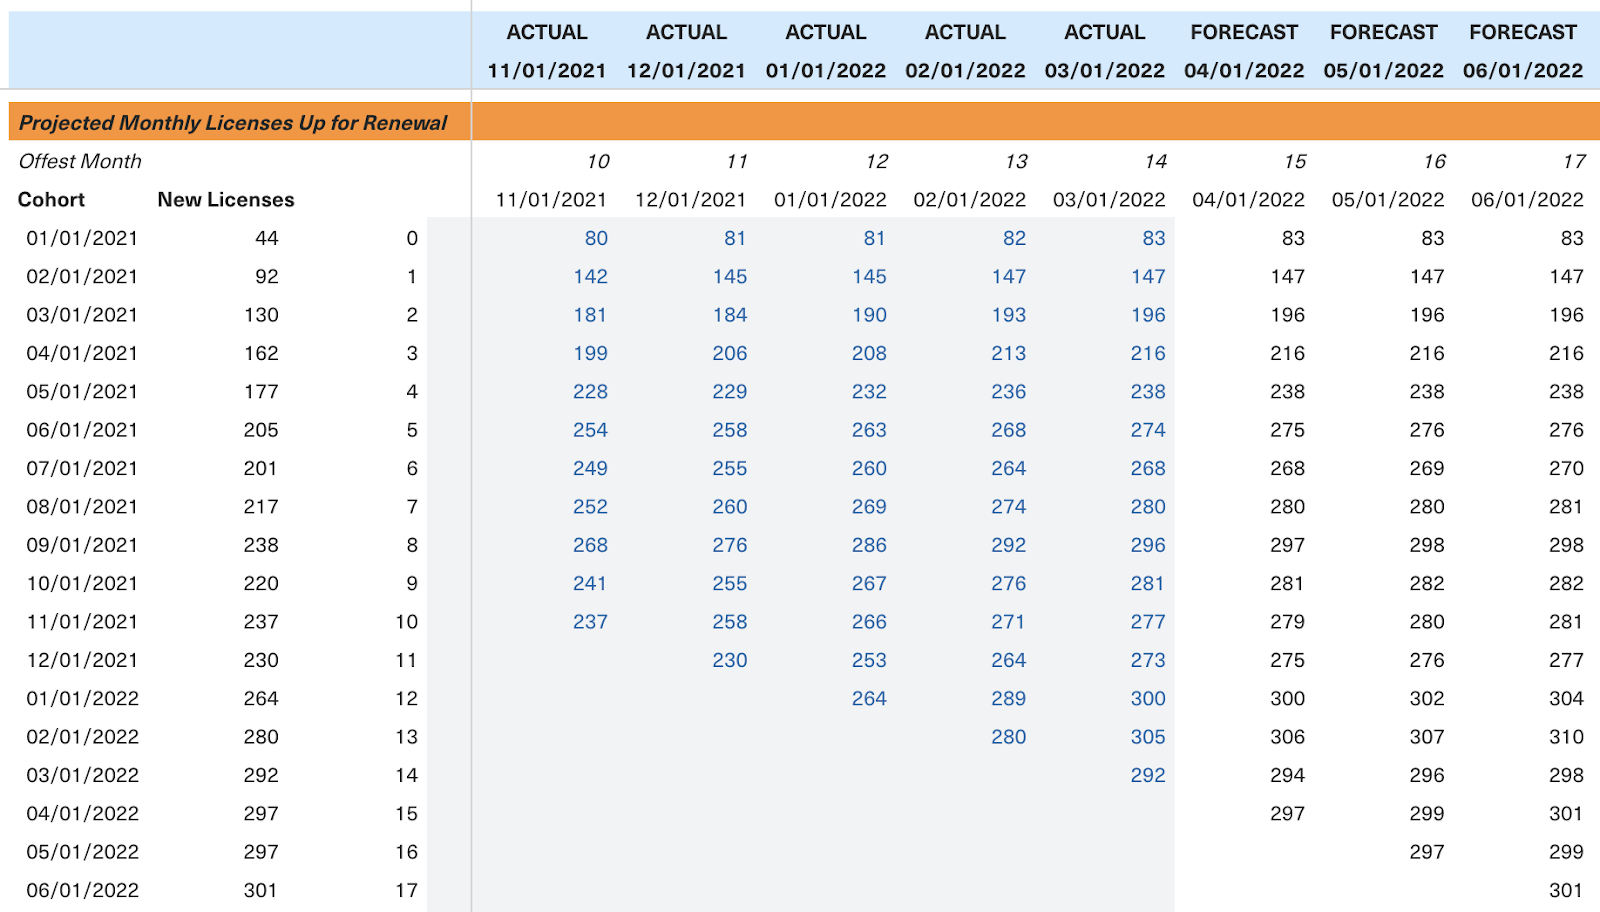
Churned Licenses
The final piece to the puzzle is understanding how much of the overall license base will renew or churn. Similar to the Expansion modeling, it’s critical to model out churn separately for month to month vs. annual customers as the bulk of churn on annual customers comes at month 12 of their service period.
Benchmarked churn rates show how customers fall off over time.
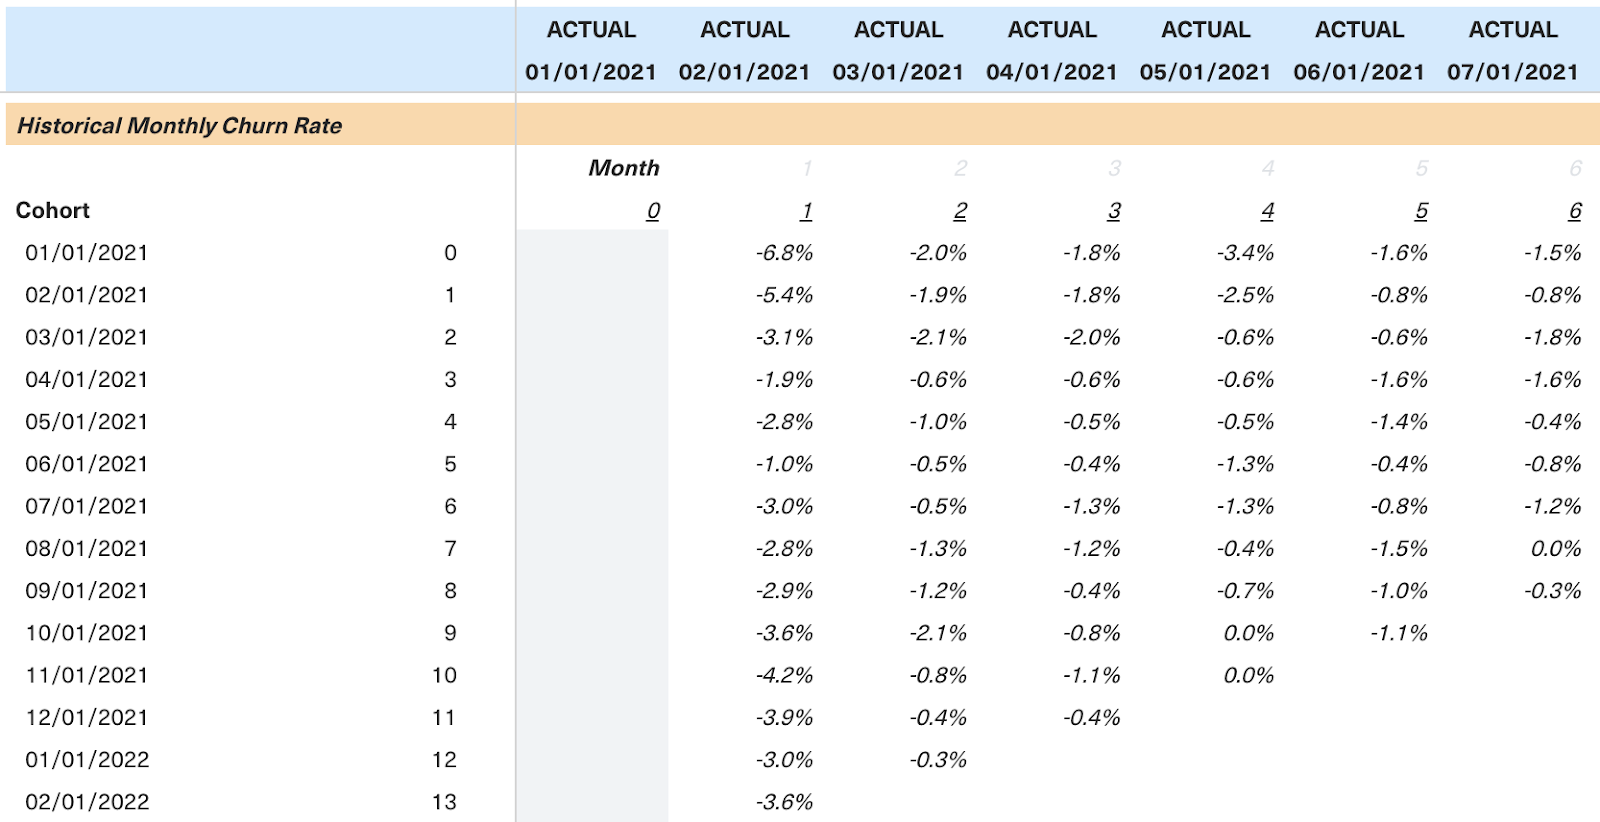
This is then fed into a projected waterfall based on cohort month.
Key Takeaways
Two things stand out as keys to success of this model: 1) the full customer lifecycle is covered, clearly laying out performance at each stage in the journey 2) cohorting allows users to see changes in performance trends over time and understand why today’s performance is informed by past activity.
Said another way, the model is flexible enough to adapt with changing business dynamics and concise enough to arm go-to-market leaders with the information they need to take action. Take a spin through the model with this Equals Template and watch the live discussion to see for yourself.
Lastly, keep the conversation going by getting in touch with Sean at whit@craftventures.com or @sean__whit on Twitter and Chris at chris@equals.app or @chris_burgner.

By Chris Burgner
Head of Finance & Analytics at Equals
