Exploring Pinterest’s Global User Forecast Models
Chris Burgner | | 6 min read
Operator’s Dilemma Series
Every company leverages a shortlist of models and workflows to run their business, and there's usually a great story behind their development. But these stories often go untold, and the lessons learned become the best-kept secrets in the industry.
We're excited to continue our Operator’s Dilemma series where we go behind the scenes to share insights from the best builders and operators in tech. In case you missed it, the first piece in this series covered how Figma measured its Self Serve business: blog post, model demo and AMA.
Pinterest’s User Forecast
Watch the Demo with Eugene
Understanding usage patterns is critical to any business, but this is especially true for Pinterest. Since inception, Pinterest was required to report on user growth externally to secure funding and prove traction in its underlying business. Internally, these metrics were every bit as critical, driving the most important decisions made across the company and serving as the precursor to monetization and revenue growth.
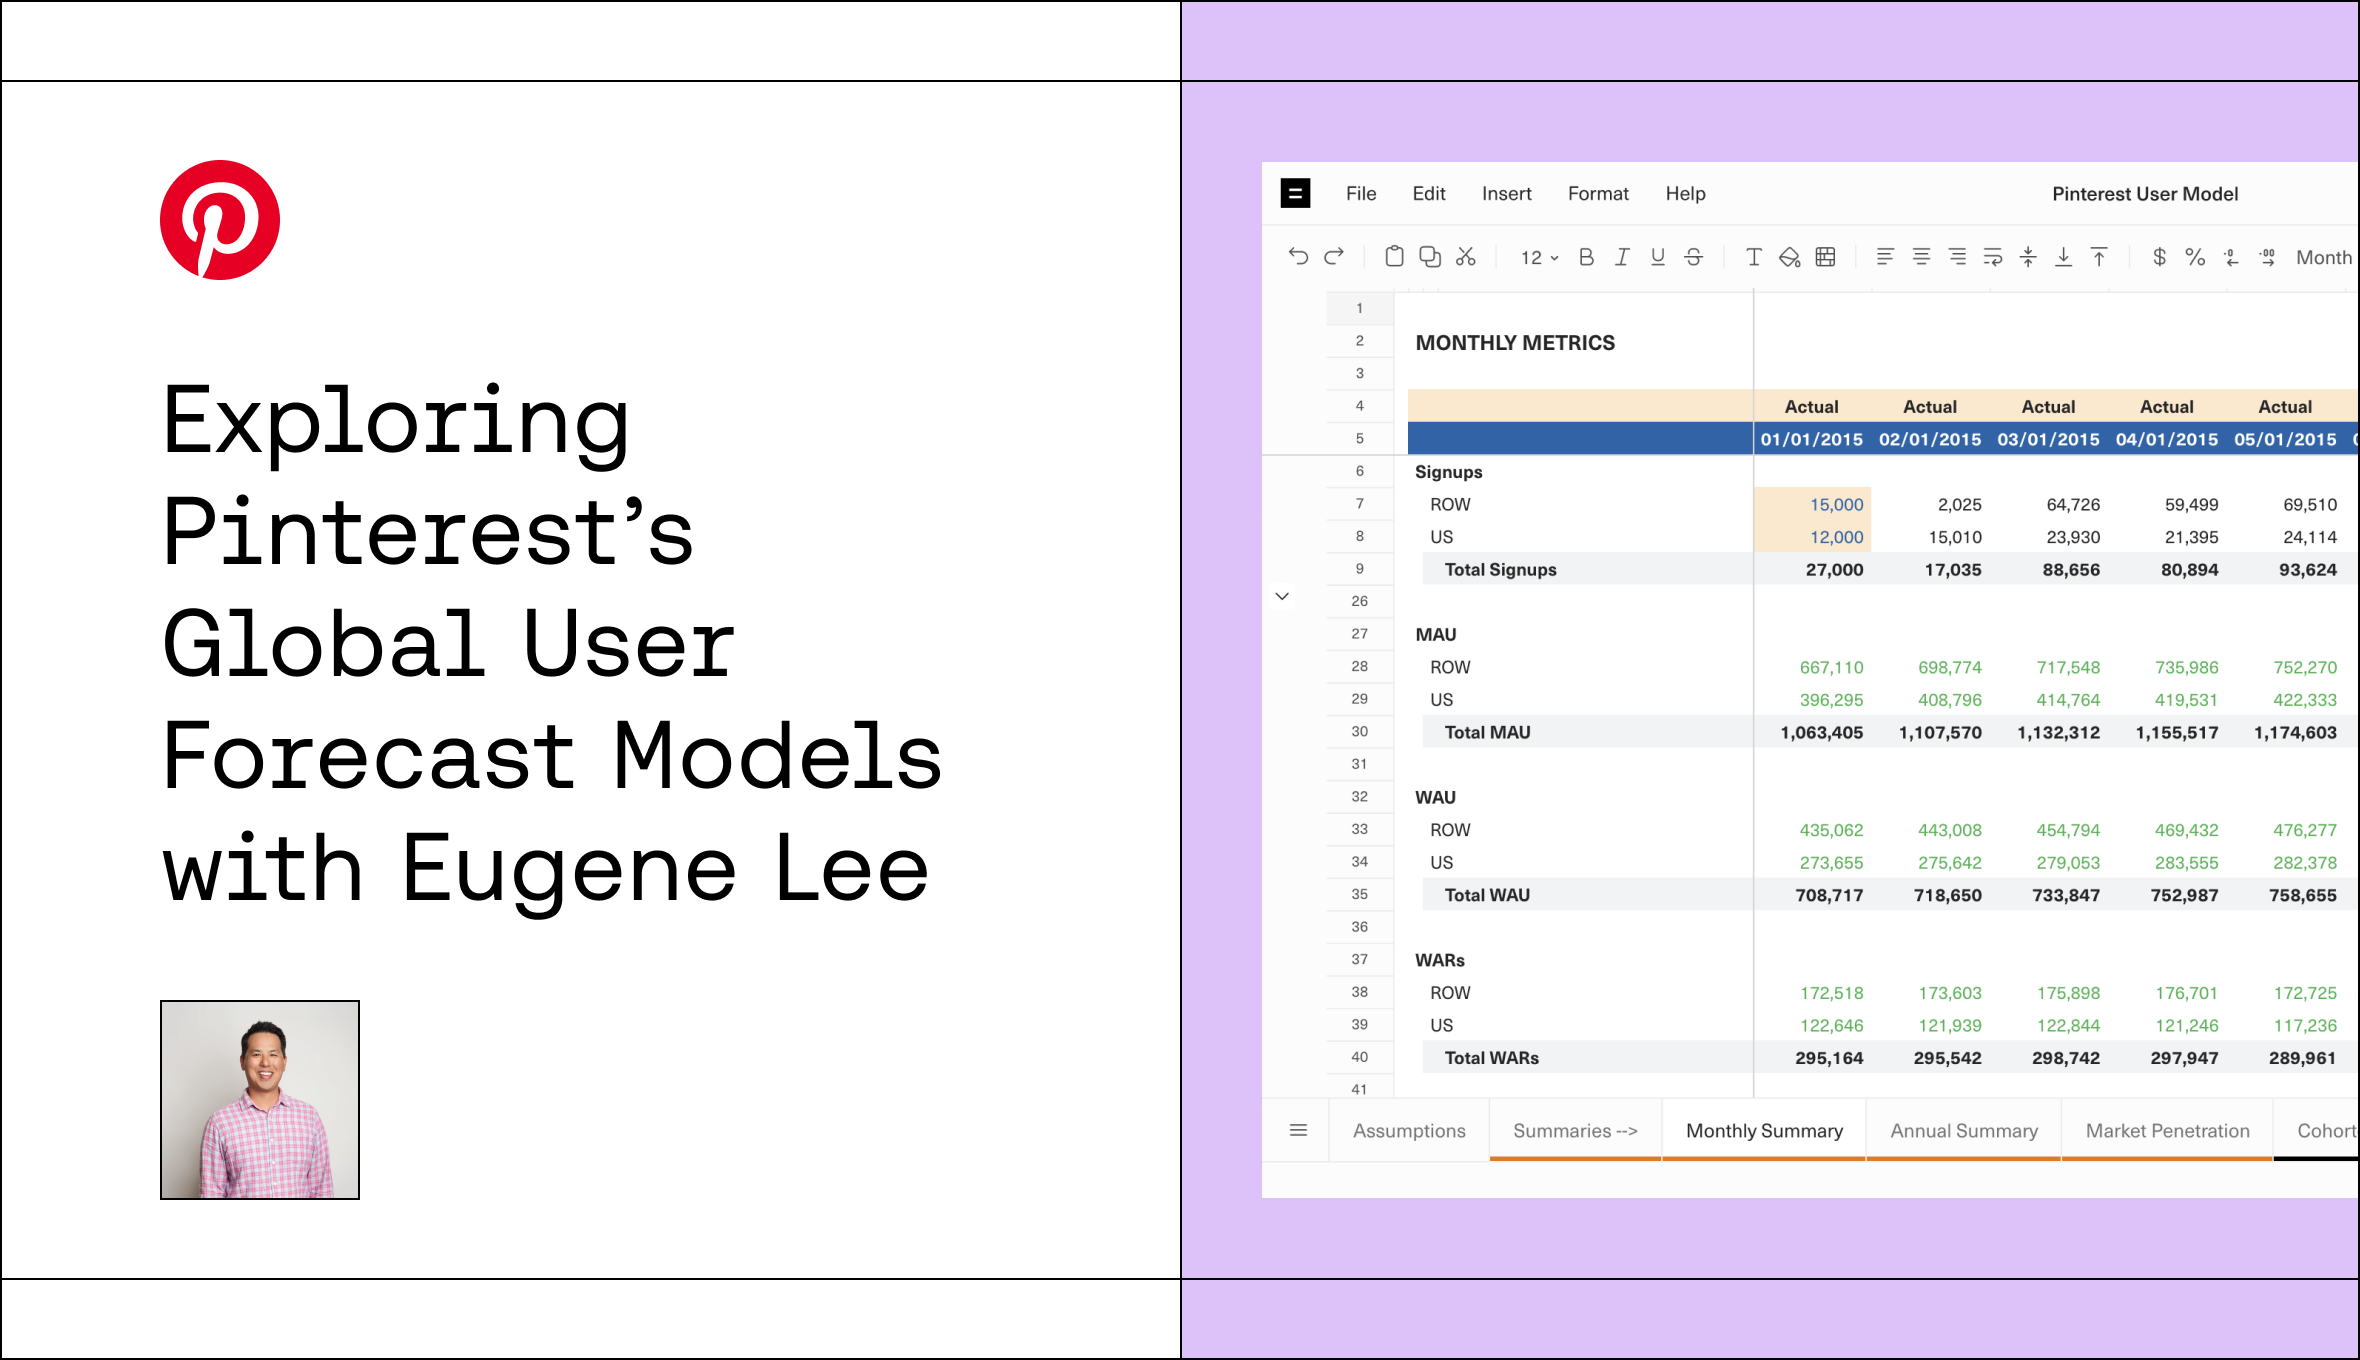
In this two part series, we sat down with Eugene Lee, former head of Business Operations at Pinterest, to learn how his team built the global User and Revenue forecast models leading up to the company’s IPO in 2019. First up: Pinterest’s User Forecast model, which is also now a Template in Equals with dummy data.

Model Context Setting
Defining the Metrics
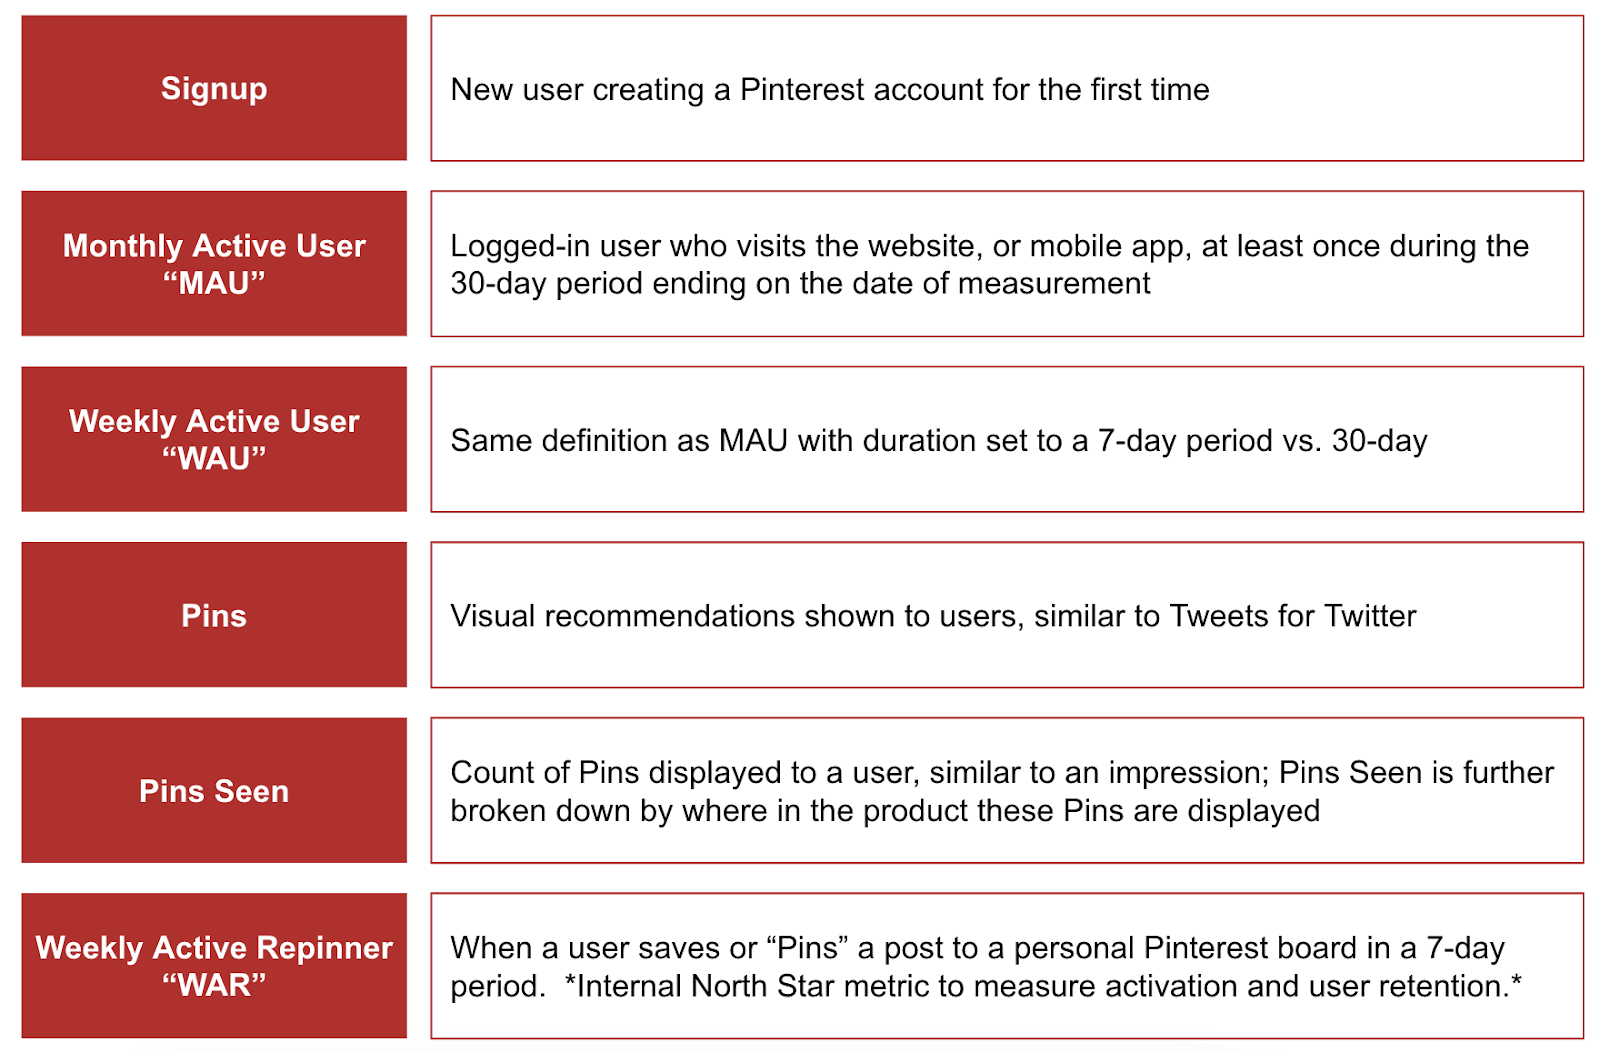
Eugene’s team started by laying out the P1 metrics that drove the business, eventually landing on a list of six in the table below. Monthly Active Users (MAUs) were a must have, and a main feature in the S1, and public filings to date, while Weekly Active Repinners (WARs) were the company’s internal North Star metric and defined activation and user retention. Pins were also critical as they represent the atomic unit of content within Pinterest.
The Importance of Geography
Another element to callout before we dive in was the importance of visibility at the country level. This view enabled Pinterest to not only understand current performance trends but also influenced how the company thought about future growth. This was generally the case for two reasons.
First, product engagement tended to spike around local holidays which vary from country to country (e.g. July 4th is a big engagement driver in the US but not elsewhere). This helped the team see around corners and understand seasonality at a more granular level.
Second, consumption patterns differed due to things like cultural norms and access to technology. The latter point was especially relevant in understanding how consumers adopted the shift from desktop to mobile.
For the purpose of this template, we’ve simplified the assumptions between the US and Rest of World (“RoW”). However, Pinterest’s actual User Forecast model was broken down by over 15 countries.
Forecast Model Overview
Now that we have an understanding of the terminology and impact of reporting by country, let’s dive into the model.
Model Overview
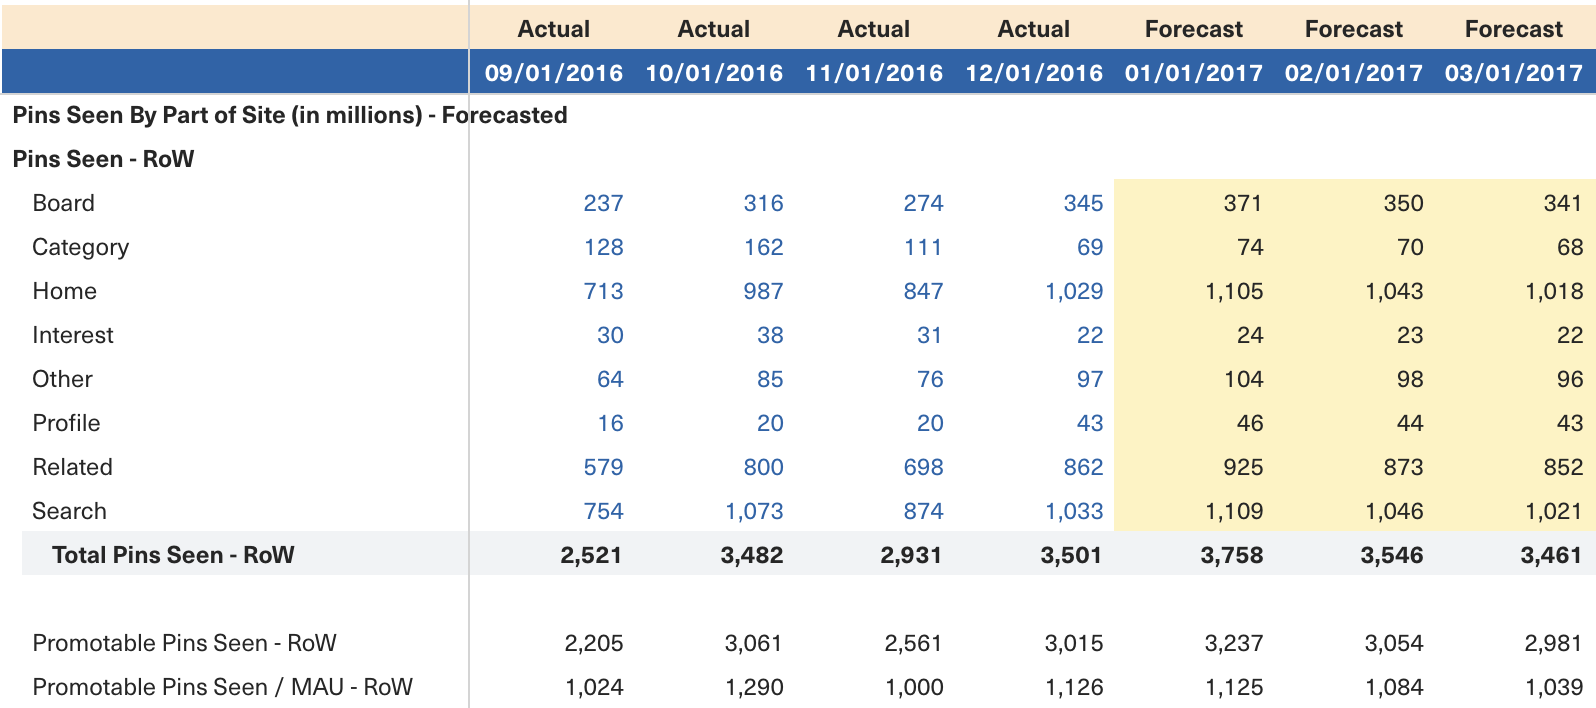
The goal of the User Forecast was to connect active users and revenue. In order to do this, they needed to translate MAUs into the number of "Pins Seen" which helped set the baseline for ad volume. Additionally, where in the product those Pins were served up (“Pins Seen Part of Site”) mattered as Pinterest only displayed ads on certain product pages.
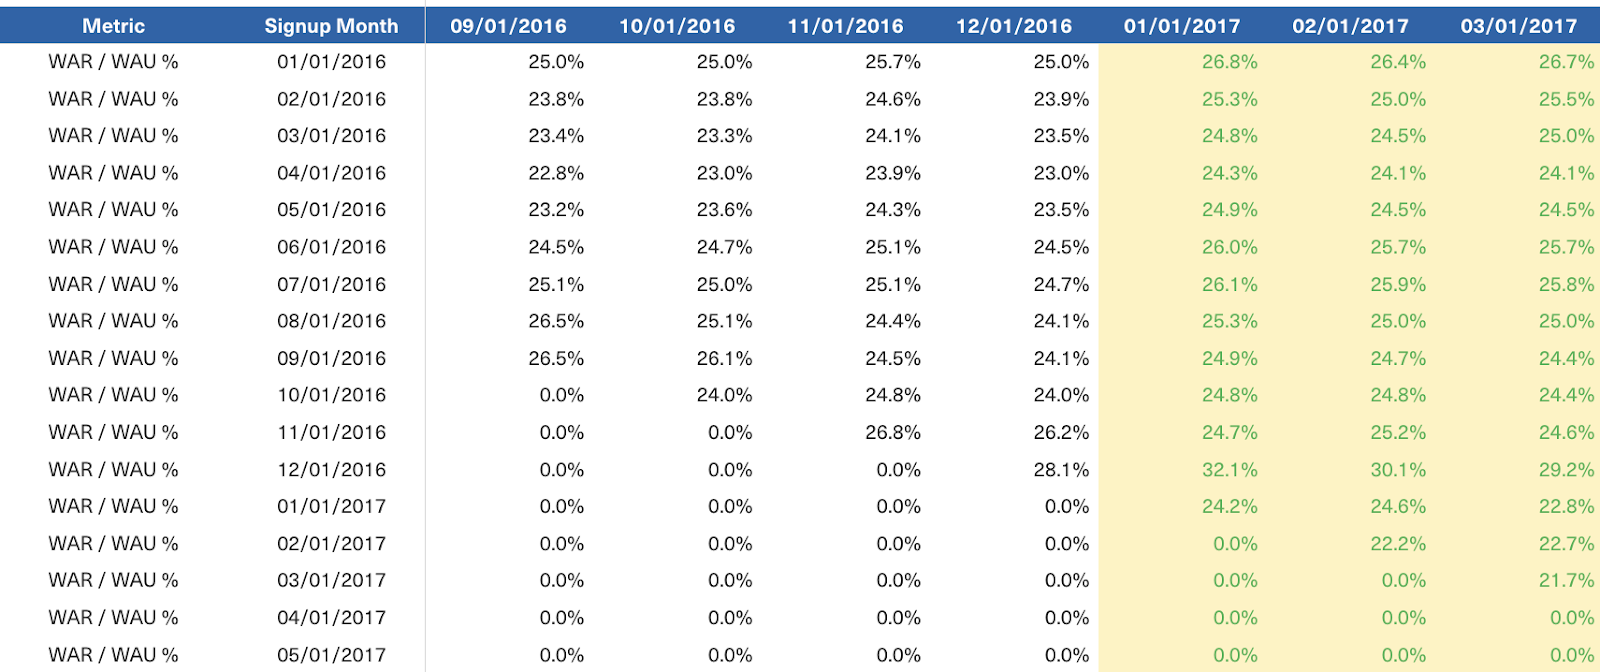
One important caveat relates to WARs. While WARs didn’t directly influence MAUs or Pins Seen volume in the model, they served as a proxy for Activation and the ratio of MAUs to WARs was a primary sense check in validating any forecast.
With this information in hand, the team could feed the downstream impact of active user volume into the Revenue Forecast which we’ll cover in Part II. Here’s how they did it.
Summaries and Market Penetration
Monthly and Annual Summary
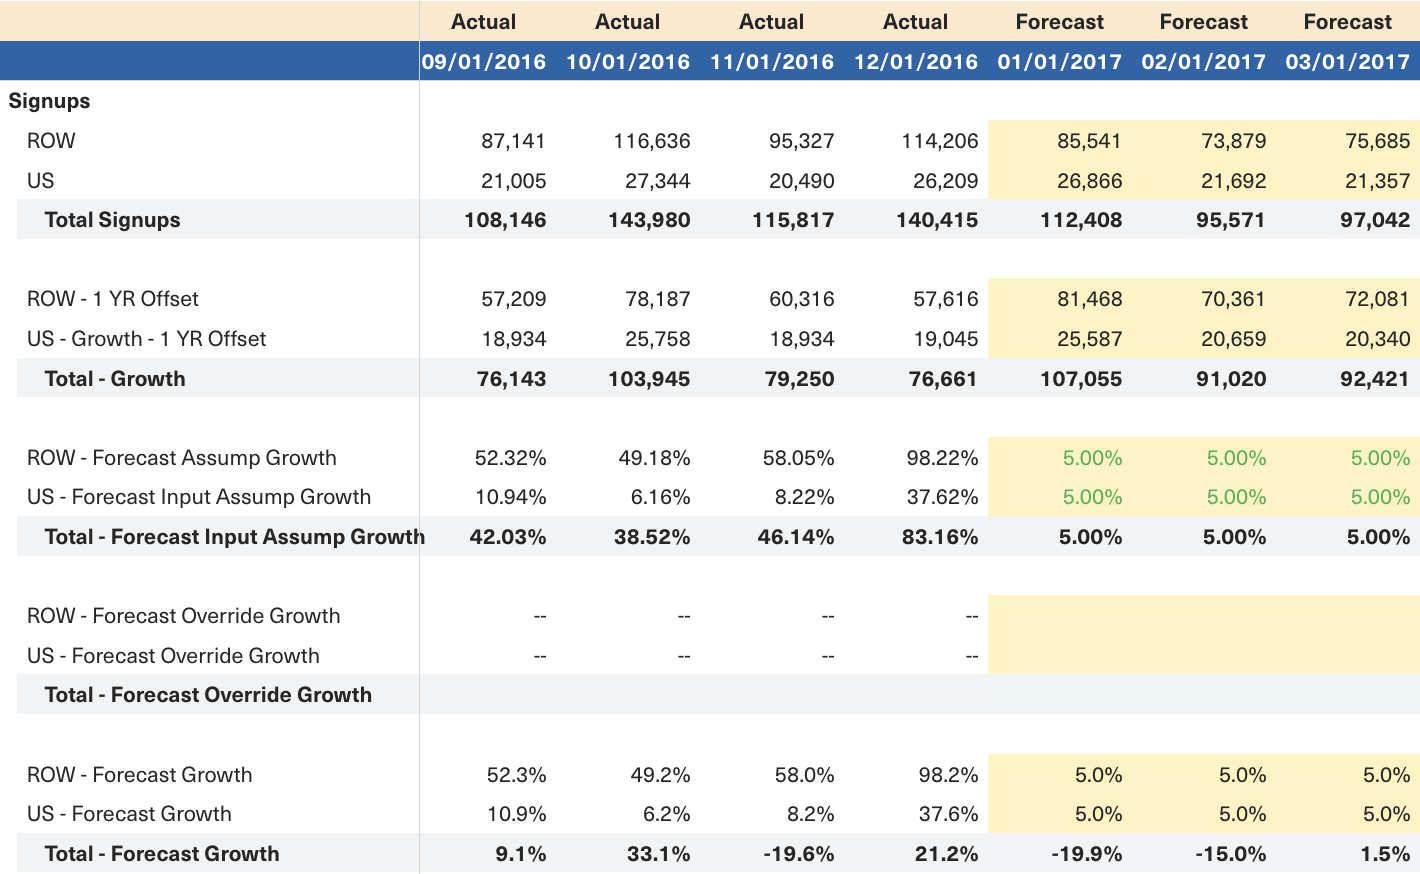
The Monthly and Annual Summary tabs bring the user metrics together in a clean time series view. However, the Monthly Summary also contains the drivers to forecast Signups and break Pins Seen volume down by Part of Site.
In the current view, the model assumes a 5% monthly growth rate in Signup volume vs. the same month of the prior year. This 12 month lookback helps lock in seasonality. However, the team also incorporated an override section to ignore instances where performance trends were proven to be one-off.
As discussed earlier, aligning on the location of Pins Seen helped connect volume back to monetization as ads are only served up on certain parts of the site. By correctly forecasting volume in these “ad eligible” locations, the team could effectively forecast monthly ad inventory, or capacity.
Market Penetration
To sense check the forecast, the team compared user growth against the internet population of each market. This helped quantify TAM and keep an eye on penetration, especially in new markets.
Cohorted Actuals + Forecasts
While the Monthly Summary tab contained the drivers for Signups, the Cohort tabs contained growth assumptions for MAU, WAU, WAR and Pins Seen.
MAUs
The core building block of any usage metric in the model begins with MAUs but looking at MAUs on an aggregate basis doesn’t tell you much. To further refine this view, Eugene’s team broke MAUs out across two axes: cohorted Signup month (y-axis) and Retention (x-axis).
Signups provided the starting point of how many users could become active and MAU Retention % created the trendline of how many users came back and engaged with the product on a monthly basis. Multiplying the two together yields MAU volume by cohort and summing the cohorts together yields Total MAU volume.
Forecast periods incorporated seasonality by inputting the Retention % from the same month of the prior year plus any desired changes to the historical baseline from the Assumptions tab.
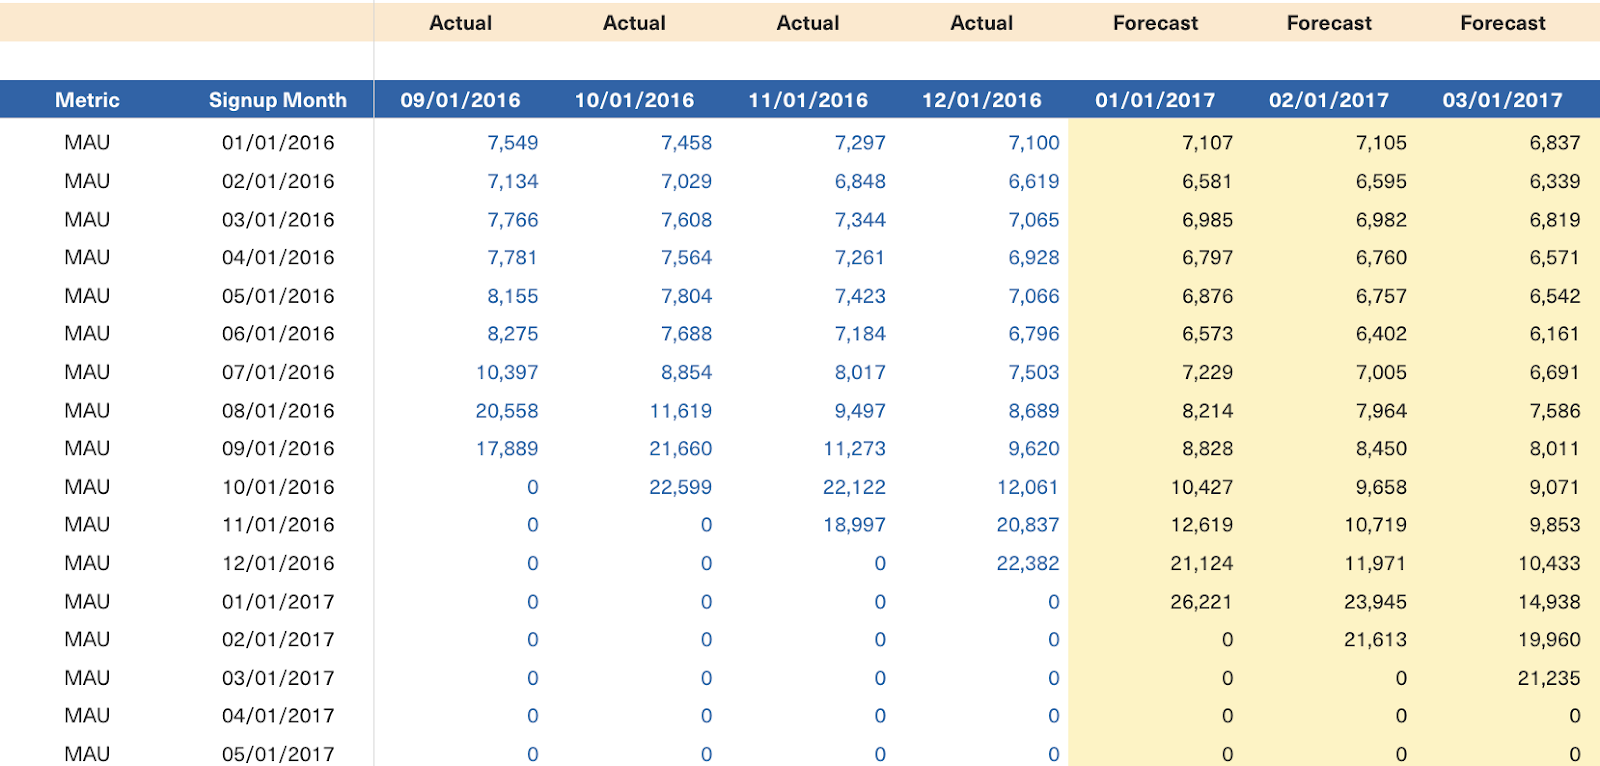
This cohorted level view was a must have to nail forecast accuracy and enabled Eugene’s team to keep a finger on the pulse of business performance. It also helped quickly surface unexpected changes to leaders which was especially important when running product experiments.
WAUs and WARs
WAUs used the same forecast methodology as MAUs but applied a 7-day duration. WAUs also served as the starting point for WARs but rather than inputting Retention % on the x-axis, WARs are derived using a simple ratio of WAR / WAU. WARs helped indicate the depth of usage among users. Those who repinned were more likely to retain, be engaged, and understand the real value of Pinterest. This would ultimately allow Pinterest to serve more relevant pins to the user.
Similar to MAUs, forecast periods captured seasonality by applying 12 month look back and an any desired changes to historical baseline from the Assumptions tab.
Pins Seen
Finally, Eugene’s team derived Pins Seen by tracking the ratio of Pins Seen / MAUs. Similar to the other usage metrics explored, Pin volume varied depending on the month of year, driven by the local holiday schedule and cohort age. Seasonality was solved using the same method as MAUs and WAUs. Importantly, the team also sense checked Pin Seen volume by monitoring trends in the WAR / WAU ratio.
Multiplying MAUs by the ratio of Pins Seen / MAU yielded Pins Seen volume in the month, a key input to Revenue we’ll explore in Part II.

Key Takeaways
The User Forecast model made it possible to easily translate between the most critical internal and external metrics and keep the team informed on performance across all aspects of the business. It was dynamic enough to surface unexpected trends to business leaders quickly and comprehensive enough to inform strategic decisions around growth, both of which helped cement the BizOps team’s reputation as an action-oriented partner throughout the company.
The model also clearly mapped how scaling the user base would translate to monetization, helping the company in its efforts to achieve key milestones and unlock funding to keep the business moving forward.
See how this was done with this Equals Template and check out our live discussion to learn more. Finally, keep the conversation going by getting in touch with Eugene at eulee@omersventures.com or @eugenejylee on Twitter and Chris at chris@equals.app or @chris_burgner.

By Chris Burgner
Head of Finance & Analytics at Equals
