Building a High Performance Spreadsheet in the Browser
Mike Stewart | | 9 min read
Spreadsheets are easy. You're a decent engineer, you could probably hack one together over a weekend, right?
The truth is, you probably could—bunch of cells, user edits, a little parsing and formula evaluation, maybe a dependency graph. But building a production-quality spreadsheet designed to operate on database-scale data volumes is a little harder.
Even simple concepts, like keeping track of some coloured rectangles, become nontrivial once you want to start squeezing out the performance limits of the browser environment.
Rectangles Are Hard
Obviously, a spreadsheet isn't just composed of simple concepts; it's actually a full compiler and virtual machine for the most popular programming environment on the planet: the Excel Implicit Underdefined Formula Language. (The only programming language with active users in the hundreds of millions—and a functional language, too. Look on with envy, Haskell.)
But recently it was one of the "simple" spreadsheet concepts, Formats, that ended up causing a performance bottleneck—and also providing an interesting journey for our team through the intersection of product engineering and computer science.
Before getting to the problem though—let's clarify what we mean by Formats.
The word might conjure up colours, bold text, etc. It involves that, but beyond the cosmetic, the EIUFL adds some more fun and semantically meaningful concepts into that bucket.
Think of how you can mark ranges in a spreadsheet as being plaintext, number, currency, or date:
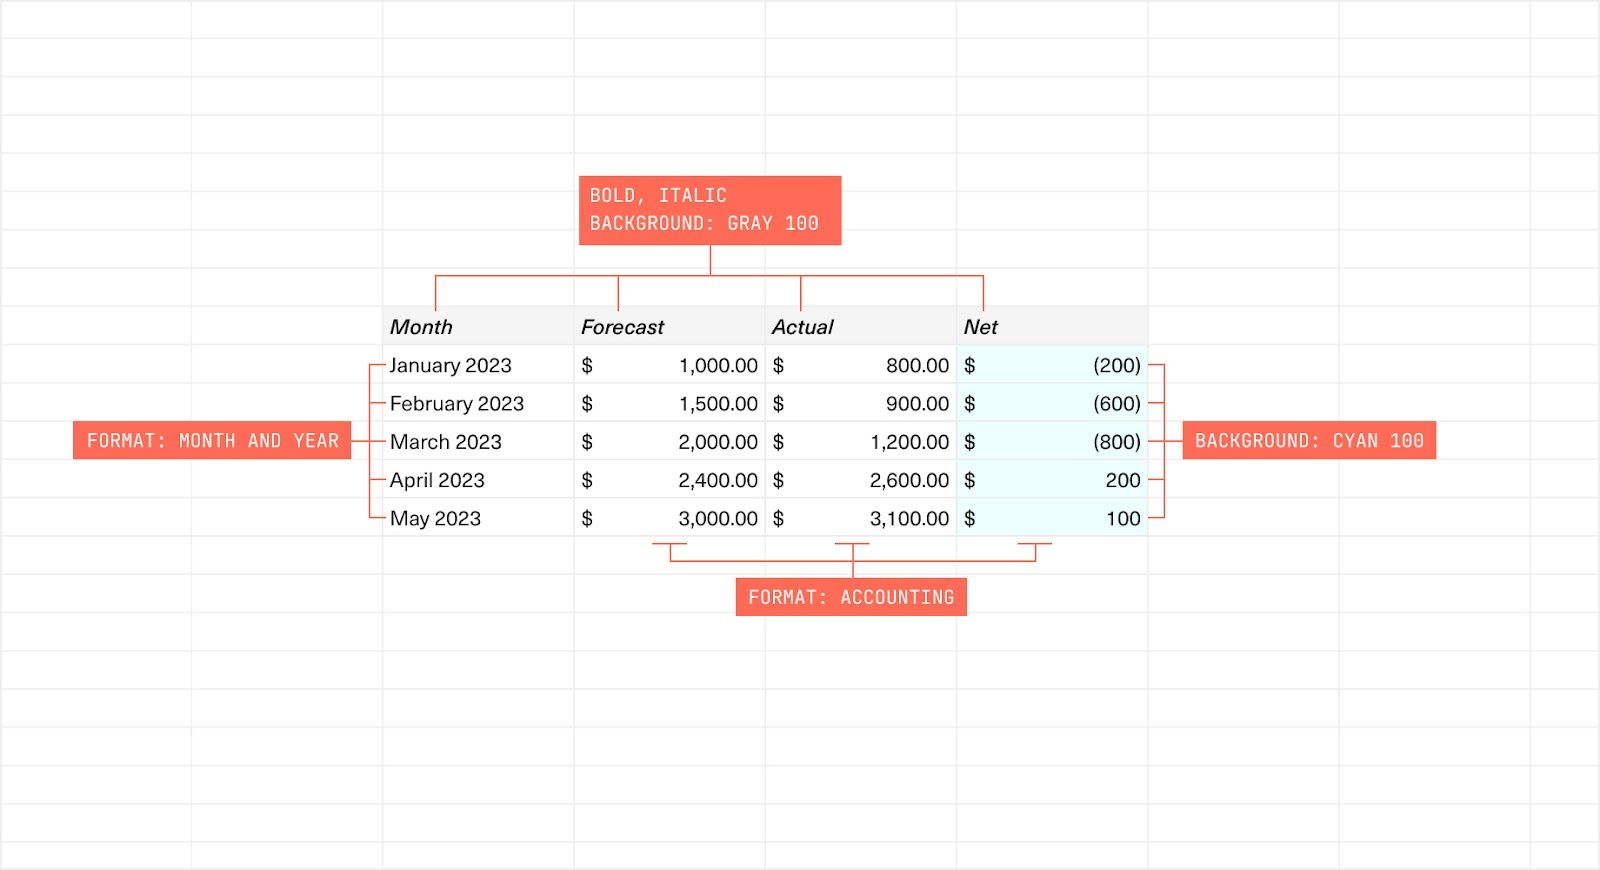
That's essentially a layer of "runtime type information" which can be set manually by a user per-cell or across wide ranges, but also dynamically changes and propagates every time you edit a sheet[1].
There's the "bare" result of a formula expression (which maps roughly to the number, string, etc. primitive types you're used to from any language), plus the format-based runtime type, which applies on a cell level.
Naturally, both of these types interact in subtle ways when you're actually running the sheet. The EIUFL likes to keep things interesting.
The User Problem
So how did these simple Formats cause problems?
We'd been aware for a while of some examples of folks running into slowness on larger workbooks. These were generally power users; in fact, one of the most affected was our own Head of Finance, Chris, who naturally builds all of his analyses on Equals. As he built out larger and more complex models, we saw a steady decline in performance across a wide range of operations.
Pulling out our performance analysis tools and diving in, a recurrent theme arose: some of the most widespread slowness wasn't coming from the actual formula calculations, ingestion of large amounts of data, or any of the "hard problems" we knew we'd have to tackle; it was coming from accesses to the Formats system.
How come? I'll lay out the historical journey of Format data structures as it evolved over time from prototype to production, and by the end I'm betting you'll be able to guess.
- Proof of concept, early 2021: The first version stored per-cell metadata for everything—the cosmetic stuff, the wacky runtime types, etc. This works! Until it doesn't. It's really common for a spreadsheet power user to select entire rows and columns—which correspond to large areas of cells—and make changes to all of it. With larger datasets, this resulted in a pretty classic write fan-out problem as every cell needed to be updated—not something you want to have to deal with on a user click.
- Beta launch, mid 2021: A mitigation on that was to store either per-cell, per-row, or per-column data—so if you changed a whole column, we just made one write, rather than a bunch. This saves work in some special cases, but if the write doesn't cover a whole row/column, you're out of luck—you still have the same write problem.
- Early 2022: As the write performance became more problematic, a new approach was tried: using an append-log-based approach, where every write to a range of cells was recorded. Multiple writes could, and did, partially overlap with each other; that was resolved by reader code on a last-write-wins basis.
This last approach optimised for writes over reads and resolved the write problems by allowing for quick writes of ranges of any shape. But as a workbook grew, the read cost mounted steadily over time, resulting in the kind of painful sluggishness that Chris ran into when building his financial models.
We knew that we could likely optimise our existing code further, add smarter caching and preloading, and maybe squeeze out an improvement.
But if your data structure is wrong, all the micro-optimisation in the world isn't going to let you scale up to 10x your current data volumes (and beyond). It was time to solve this properly.
Getting Into The Weeds
At heart, what is this Formats problem, in computer science terms?
If you abstract out all of the spreadsheet details, it boils down to: "how can we efficiently represent disjoint rectangles in a 2D coordinate space, each with a value associated?"
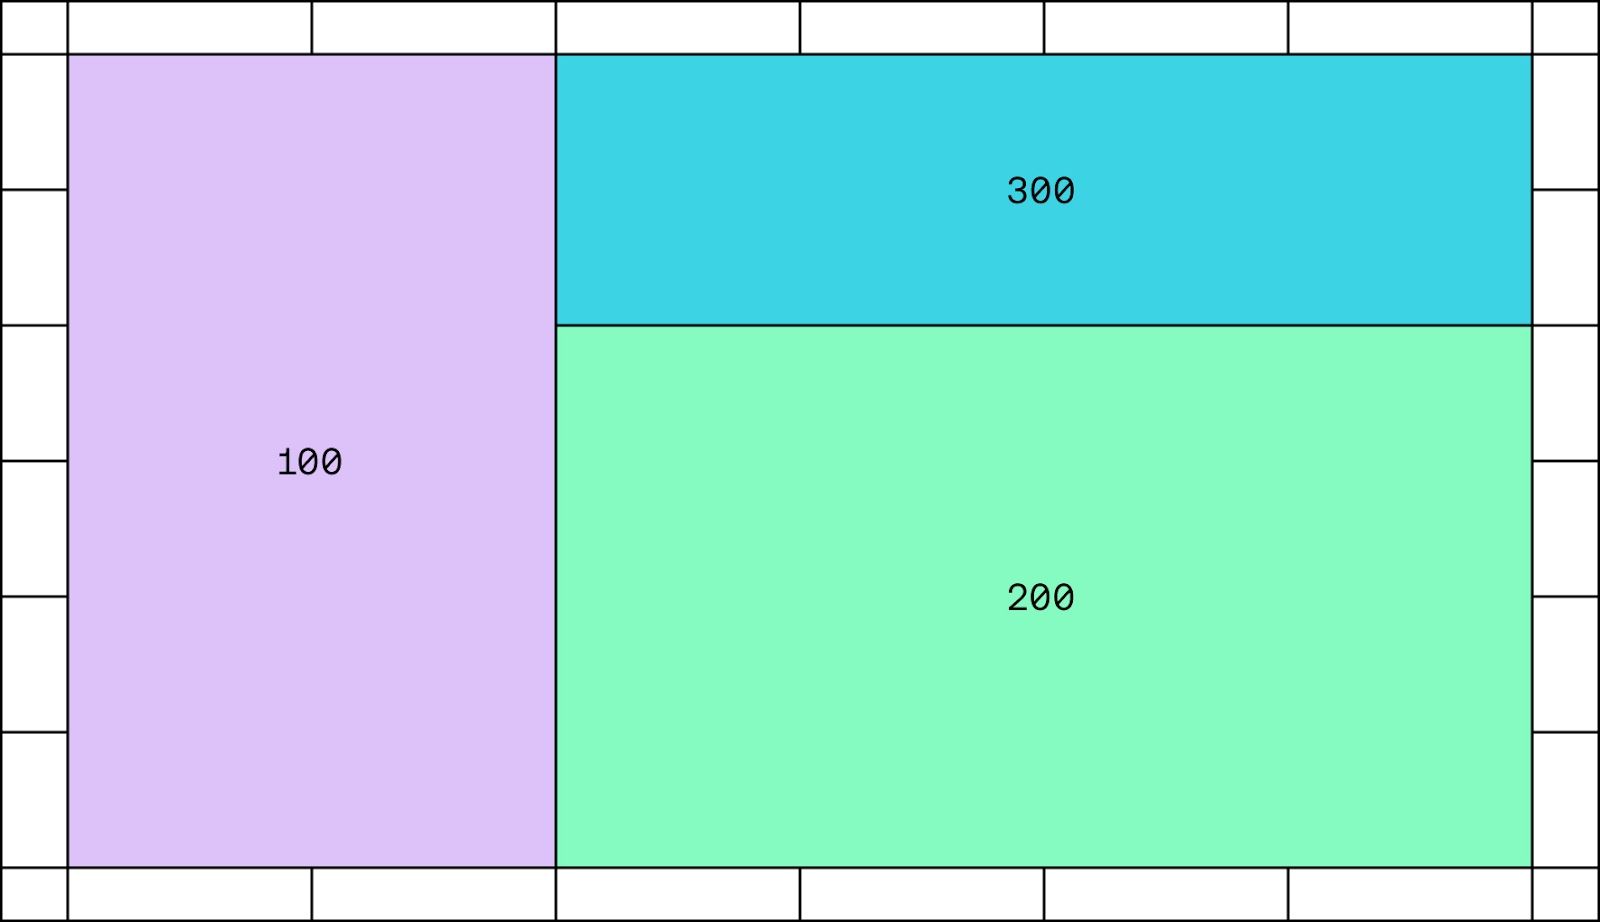
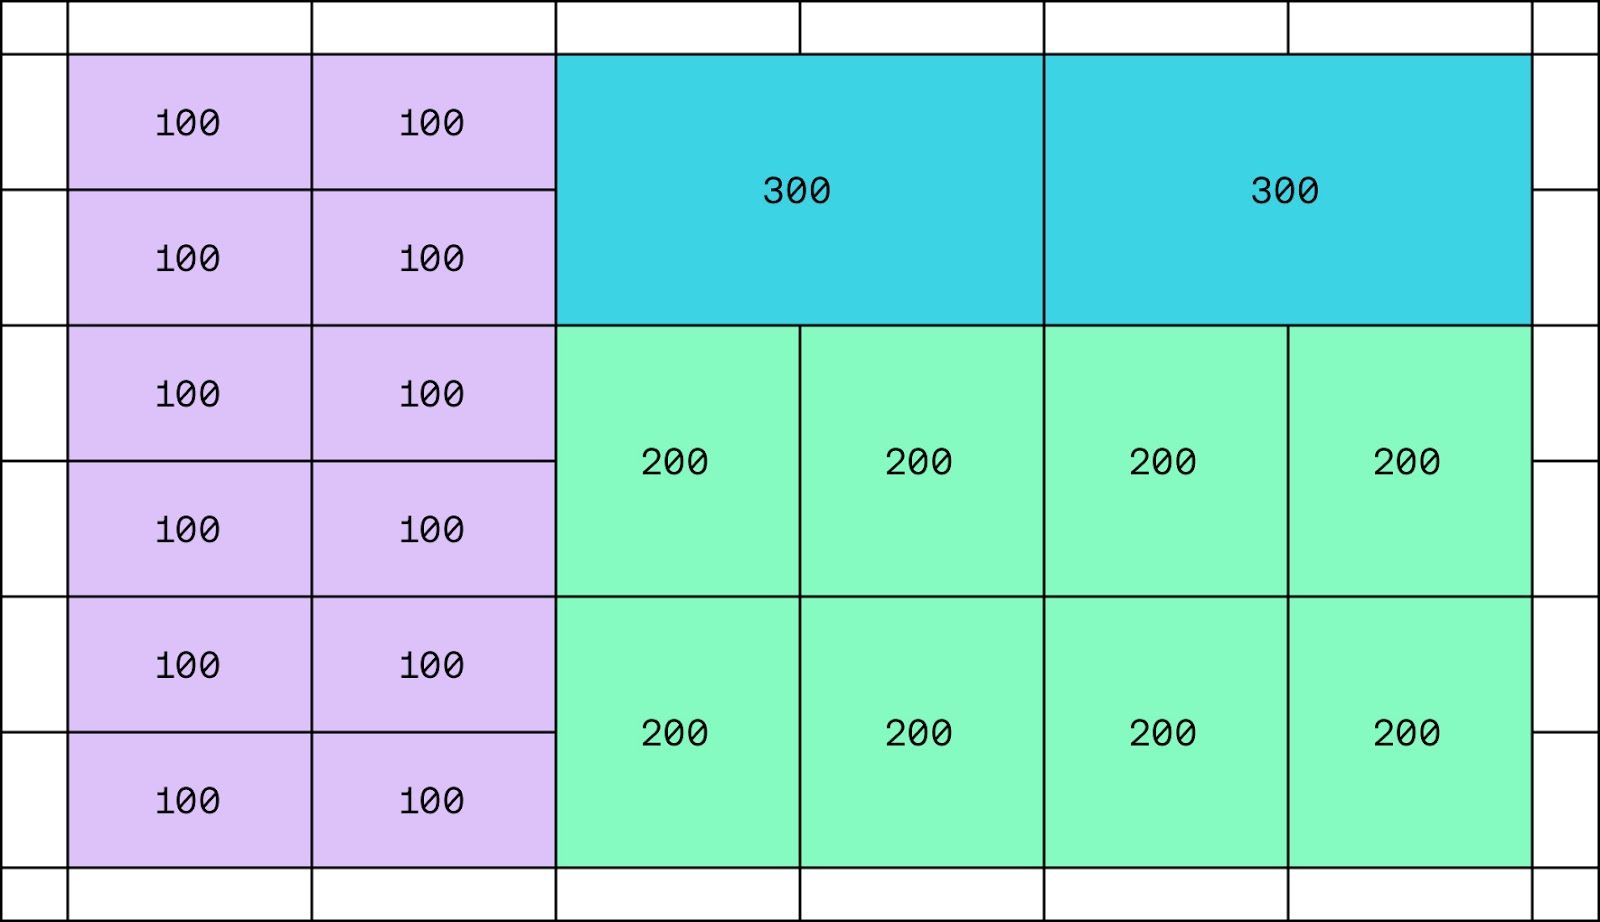
Where part of what efficiently means here is with the minimal number of rectangles. We don't want to end up with a million tiny rectangles, one for every cell in our spreadsheet:
So our data structure should:
- Represent disjoint rectangles on a 2D space
- Consolidate them down to the minimum set of rectangles required
- Have fast reads (lookups by position) as well as fast writes (changes to the rectangle space)
No pressure.
But I hear you exclaim, gentle reader—this must be a known computer science problem. So it should already be solved, right?
In some sense, it is; this is "just" rectilinear computational geometry. And indeed, the problem of partitioning an arbitrary rectilinear polygon into a minimum number of rectangles is a solved one. But real engineering isn't that simple; as we'll see, "solved" doesn't always mean solved.
Actual Engineering
So what actually worked? Forget computational geometry, you want results.
What worked in practice ended up having 3 basic elements:
1) For core storage: we stored the rectangles in-memory as simple JS Objects in Maps keyed by numeric IDs.
We've learned this many times over, but working with primitive JS objects can be extremely fast if you do it right.
"In the browser" has a bad reputation in terms of performance, but V8 in particular is one of the most optimised execution environments on the planet, particularly if you follow some basic principles of keeping objects statically shaped to keep them out of dictionary mode (see Jay Conrad's excellent "Tour of V8" for an intro on this).
Along the lines of Norvig's "Latency Numbers Every Programmer Should Know," when building, it's been invaluable for us to keep in mind an analogous "latency numbers every JS programmer should know" with some ballparks for working with JS primitives, which are universally faster than engineers expect when onboarding.
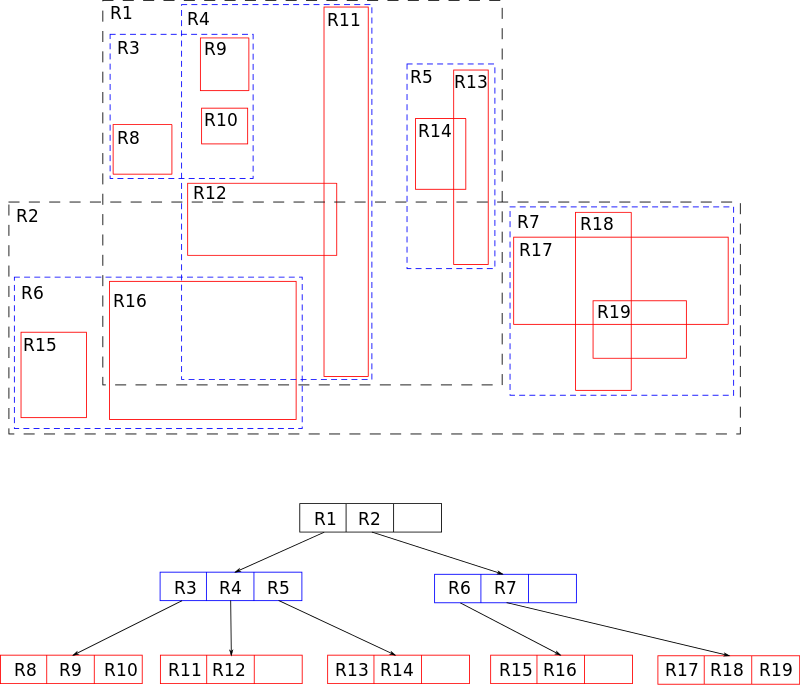
2) For read accesses: we used an R-tree spatial index of all the rectangles. This is a slight denormalization, but well worth it.
In case you're not familiar with R-trees, if you have data corresponding to points or rectangles[2], they're good for fast queries of the form "give me all data intersecting this range." The core concept is fairly simple: you build a tree where every leaf node is one of the rectangles you're storing, and the non-leaf nodes are the minimal bounding boxes containing them.
As with every real world data structure, there's quite some tricksiness to make it performant, though.
We evaluated building our own, as our experience is that most JS libraries are not designed for high-performance—but ended up using the excellent rbush library by Volodymyr Agafonkin. (If you're building high-performance javascript apps, it's very much worth taking a look at his projects—they're gems of polished craftsmanship in the field of often-underwhelming off-the-shelf data structure libraries to be found on npm.)
3) For writes: this ended up being the most interesting part.
Recall that the challenge here was ensuring we would merge together rectangles where possible, to avoid ending up with millions of small ones when a few larger ones would do.
As mentioned in the last section, from a computer science point of view, this is a "solved problem":
- You take the merged polygon of all the area covered
- Transform it into an "intersection graph" representation, where the nodes are the possible cuts you could make, with edges connecting cuts which intersect each other
- Find the maximum independent set of that graph of cuts (which, in layman's terms, will be the biggest set of cuts which don't intersect each other).
Phew! I don't blame you if you need to read that one through a couple of times to digest it.
We didn't do that.
Why not? A few reasons:
- This algorithm gives a guaranteed "perfect pack," but scales with ~O(n3/2). That mightn't sound so bad, but compared to an O(n) solution, for 10k inputs that's 100 times slower, and for 1M inputs that's 1000 times slower. We've already learned through hard experience that big-O matters.
- It wasn't stable: as it throws away the current structure each time to recalculate what's optimal, it can easily result in huge diffs after small perturbations. That's a Bad Thing in practice.
- Finally, it's complex! The transformation to/from a graph-theoretical representation results in high-complexity code in practice. Maintainability is key.
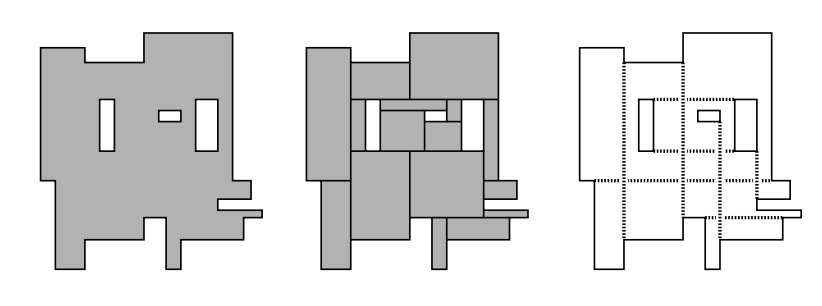
What did we do? We chose a far simpler consolidation algorithm: we repeatedly merge any adjacent rectangles which precisely share an edge, and just keep going until we can't merge any more.
There's a real tradeoff in this—we're no longer guaranteed a "perfect pack." Since it's a greedy algorithm, it may get stuck in local maxima; you can design pathological inputs of awkwardly interleaved inputs, like the teeth of a key, which it'll fail to merge due to its naivety.
But on the plus side, its worst-case runtime is only O(n). That pays for a lot of imperfect packings.
And in practice, we've observed exactly zero pathological situations resulting from this in production, while gaining the benefit of simple code and fast writes.
Results?
Rolling this out to our users (gradually, via feature-flag), we were able to see large spreadsheets which previously had many unusably-slow user interactions drop down to very usable interaction latencies. (Still far from perfect, due to other issues, but one step at a time.)
And anecdotally, for our power users who were building large models (like our Head of Finance, Chris), our largest workbooks and templates switched from unusably slow to ... just working, like they should.
Having fast access patterns for this data also allowed us to simplify and optimize several other features built on top (sorting, filtering, data imports from SQL, etc.) which previously had to hack around the limitations of the old data modeling.
Conclusion
Every system has limits; at some point, I'm sure we'll have to replace this one too. But based on our projections, it should serve us long enough to scale into the millions of rows of data that we're targeting for the next generation of the app.
If this sounds like the kind of challenge you'd be interested in taking on—come join us.
¹ As a very simple example, adding 1 to a date results in another date, while adding 1 to a number results in a number. Once you start chaining values through functions, the semantics start getting more complex.
² Technically rather than rectangles, I should say "hyperrectangles" since they can happily operate on an N-dimensional space, but I refuse to believe anyone has ever used that term in real life.

By Mike Stewart
