How a daily email changed the trajectory of Intercom
Bobby Pinero | | 4 min read

Startups are about speed. The pace at which you learn from the market, iterate, test and launch is often the difference between life and death for a young company. Des Traynor, co-founder of Intercom and one of the smartest folks on building startups, talks about speed as one of the 4 critical elements in why startups succeed. As he puts it:
“Speed is literally the piece that startups trade with. It’s the difference between a startup and everything else… It’s the surest thing that turns me off a startup, is if they don’t move quickly.”

I then came across this tweet from Hiten Shah a few weeks later.
The #1 advantage you have as a startup is speed. If you can’t move fast enough, you’ll inevitably die trying. The speed you execute at is relative to the product and market you are in, but there isn’t a particular speed limit. Only a lack of creativity when things slow down.
— Hiten Shah (@hnshah) July 9, 2021
Which got me thinking, what is the role of Finance at an early stage startup in enabling or supporting speed? My best answer: it’s all in how Finance establishes a company’s operating cadence. What follows is the story of a simple cadence we built at Intercom that changed the speed at which we operated and produced real business results. It all started with a report called ‘The Daily Pulse.’
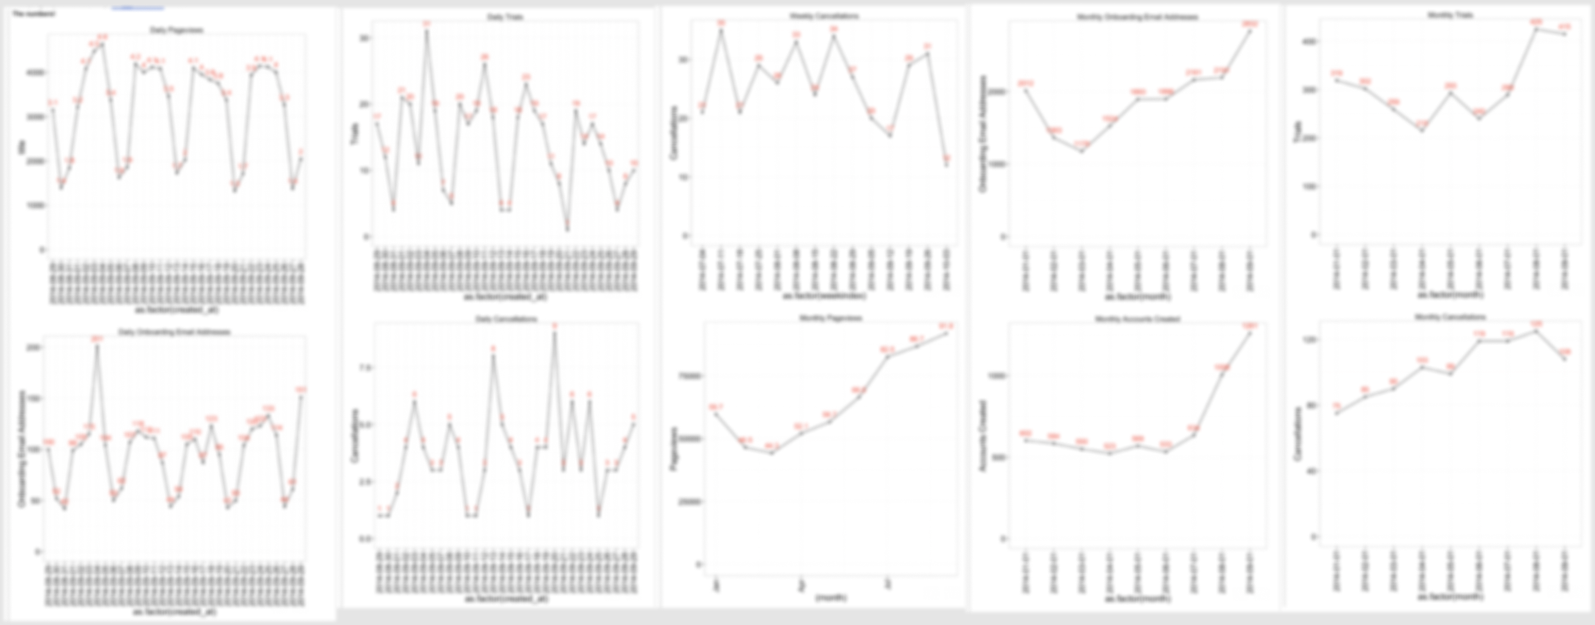
I built the first version of ‘The Daily Pulse’ around 6 months into my time at Intercom (at that point we had ~30 employees and were between $1-5M ARR). 'The Daily Pulse' was an auto generated email with a set of simple graphs sent out to everyone in the company, every day at 5pm PST, summarizing our business that day. To say the metrics were simple would be an overstatement - it’s about as basic as reporting gets. See the sample, blurred screenshots below. Yet, ask any early Intercom employee and they’ll remember its impact.
💡
Two implementation details that maximized the efficacy of ‘The Daily Pulse’ relative to other reports:
1. The charts were directly embedded in the email. No opening a pdf or going to another site. Also, the charts presented well on mobile.
2. It was simple to parse. The metrics were all straightforward. You knew immediately if things were good or bad.*
To be clear, all of these metrics had for some time been readily available in dashboards. The real magic of ‘The Daily Pulse’ was in a few big shifts created across the company.
- Every employee now had results pushed to their inbox. It allowed every person to own what we cared most about at the time - growth - which pervaded decision making across the entire company.
- We forced a check in 👏 every 👏 single 👏 day. You better believe that if something looked funny at the end of the day there was a reply-all from our CEO, Eoghan, or one of our function heads. We were all on the hook to chase down answers within 24 hours which drove extreme accountability.
- We had incredibly fast feedback loops. Launch something on product hunt? Introduce a new page to onboarding? Break some instrumentation in the funnel? See early indicators the same or next day.
We then coupled ‘The Daily Pulse’ with a weekly in-person meeting on Friday afternoons. It was our forum to discuss everything that happened the past week. Attendees for that meeting included our CEO and heads of every function (Sales, Marketing, Growth, Product). Finance would lead this meeting, and would bring the following materials:
- An aggregated view of our funnel with weekly, trended analysis.
- A perspective on all live experiments, such as pricing, in-funnel tests, new marketing material, etc.
- A forecast update relative to plan for the quarter.
Those were some of the most fun, important, and stressful meetings during my time at Intercom. Every Friday was a dizzying scramble preparing the latest data and insights. At the same time, many of the trajectory-changing ideas and decisions that we made in the early days of Intercom were made in those Friday meetings.
My challenge then to early finance operators; what can you do to drastically increase the speed at which your startup gets feedback and makes decisions? Perhaps it looks something like the daily pulse, perhaps not. My instinct is that there’s something every business can be pulsing on a daily basis. As the lifeblood and competitive advantage of your startup, it’s your job to help maximize speed.
* Over time we also built in more sophisticated metrics and alerting to the daily pulse. For example, if conversion rates fell beyond 2 standard deviations of the mean for any given day, we’d alert the team responsible for that conversion. But that came with time.

By Bobby Pinero
CEO and Co-Founder of Equals.
