How to build a single source of truth for ARR
Chris Burgner | | 9 min read

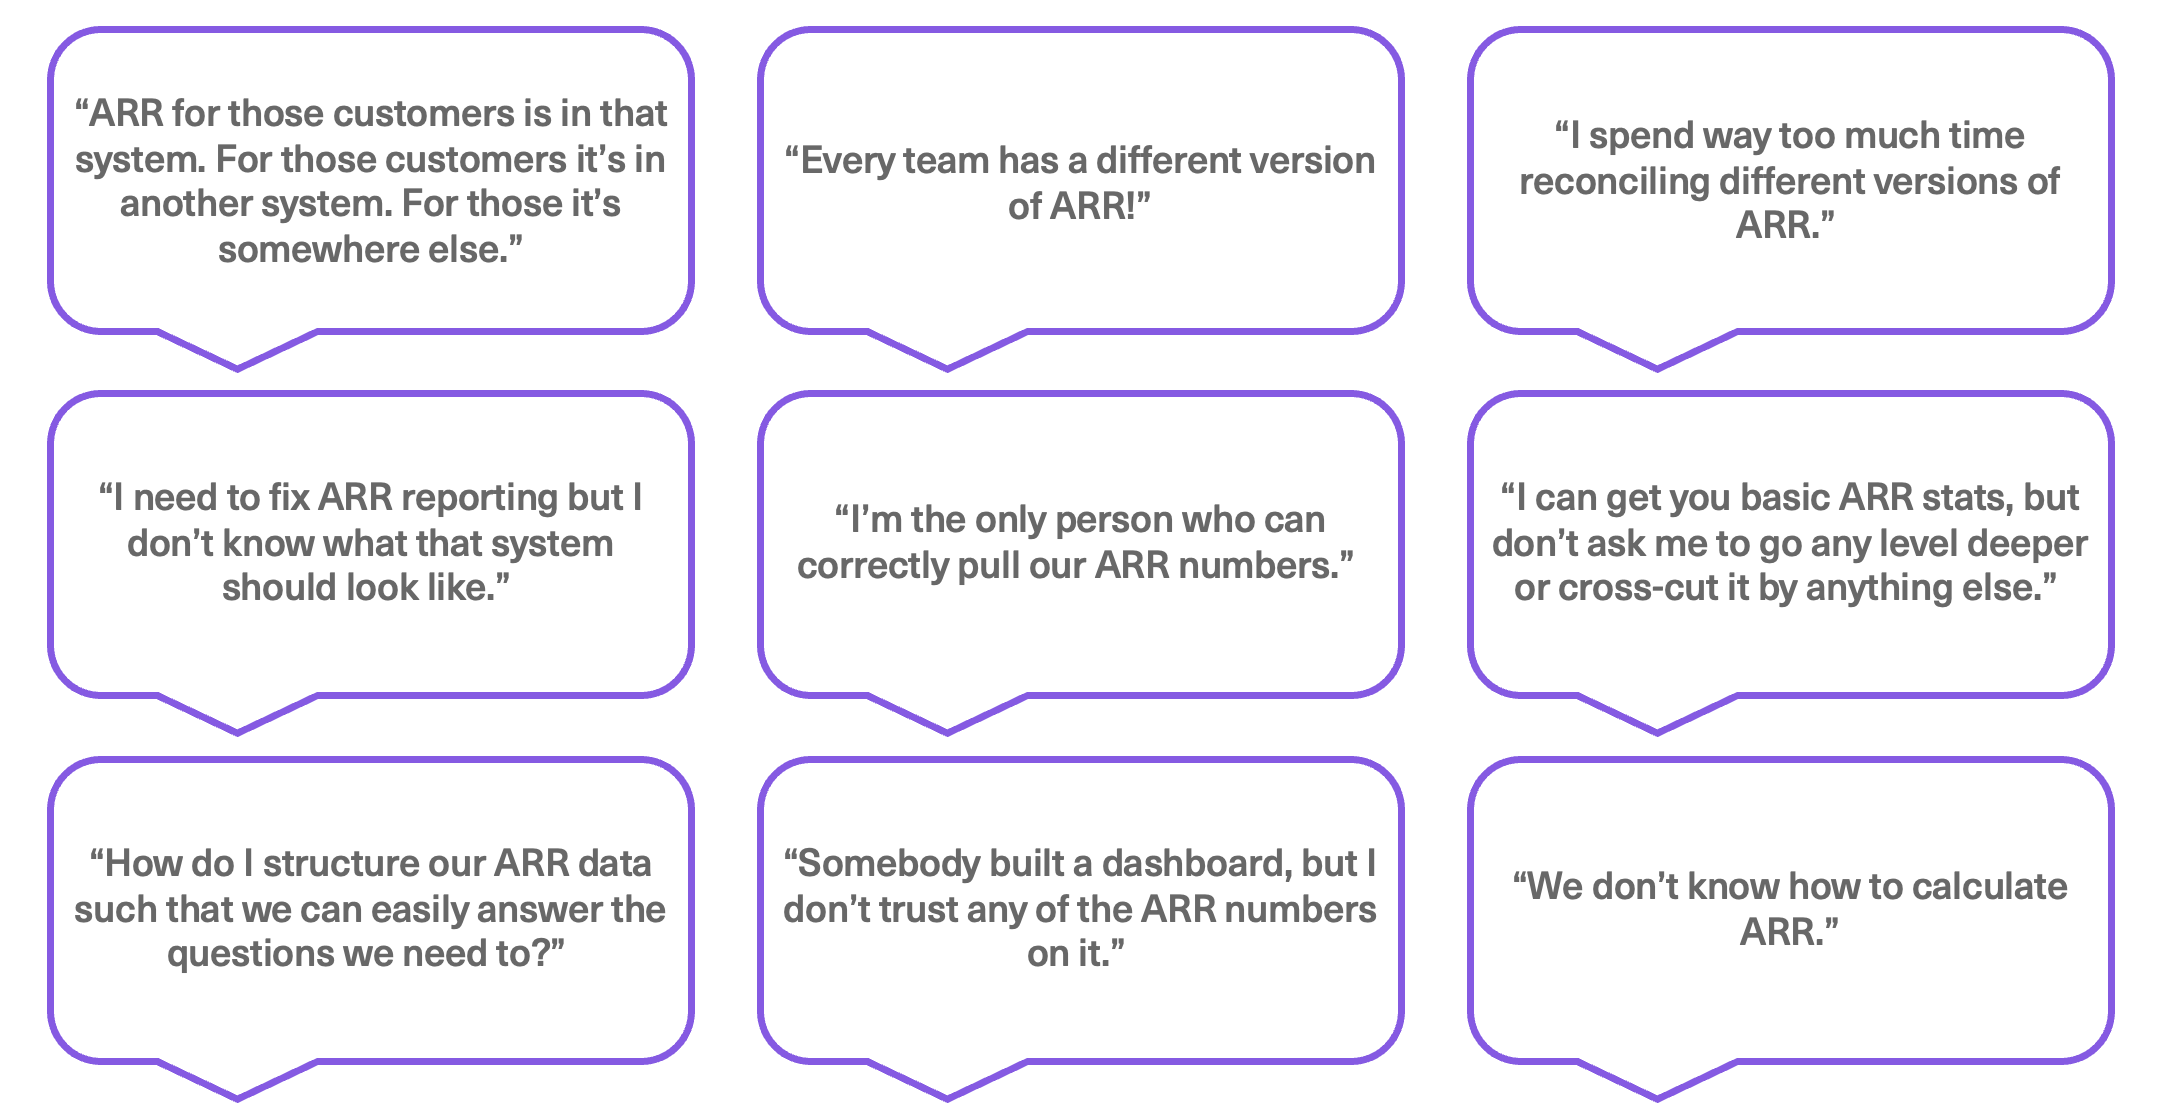
Annual recurring revenue (ARR) is the most basic and critical metric for any SaaS business. It’s the foundation upon which every analysis is built. Yet, talk to early stage SaaS companies and for most ARR reporting is a mess! “Fix ARR reporting” is invariably at the top of the priority list for any first finance or operationally oriented hire.
Sound familiar?
These struggles don’t only apply to early stage companies. Most would be surprised at how messy it can be at late-stage, more established companies.

There’s good news though! We went through all of the pain of architecting our ARR source of truth at Intercom, and we ended up with an excellent, flexible, and credible source of truth upon which most company reporting was built. However, getting there was fraught with mistakes. Our intent is to help others navigate towards a system for reporting on ARR with all the benefits of our learnings!
This is the post we wish existed from the get-go at Intercom. Within it we cover:
- Why your ARR data should live in a SQL data warehouse.
- Taking the first step - defining the business logic for ARR.
- How to structure your core ARR table.
- Getting organizational buy-in for your core ARR table.
- Enriching ARR with modular data sets.
- The final product.
Let’s jump in!
The first thing to understand - your ARR source of truth should live in a SQL data warehouse.
Systems like Excel, Stripe, Salesforce, Zuora, Profitwell, ChartMogul, SaaSOptics, Netsuite, Chargebee, Quickbooks, etc. are all great places to start… and they might each work for a little while, but they will not ultimately scale. One of the most common mistakes we see is to hold on to any one (or multiple) of those systems for too long. Sooner than you’d imagine, it’s critical to move to a SQL data warehouse.
When? Here are a few good questions to ask yourself.
- Are there multiple stakeholders in the company that need access to ARR details?
- Are there multiple systems across the company that need access to ARR details?
- Do you want to run basic analysis in which you enrich your ARR data with funnel, product, or other types of data?
Answer yes to any of those questions? It’s time to move to SQL. Why?
ARR is central to your business - it powers nearly every go-to-market system and is at the core of nearly every analysis at the company. Tools like Stitch and Fivetran allow you to easily centralize the data you’ll need to enrich ARR analysis within your data warehouse. With all of your data in one place, it becomes easier to answer important questions like “how many of your new paying customers use a feature? or “how many of your churned customers were active 3 months before they churned?” Similarly, tools like Hightouch and Census make it easy to push data from your warehouse to your business applications. Your data warehouse should be the hub that powers all of your systems and analysis, and ARR needs to live within it.
Lastly, every business has its own subtle complexities. SQL allows you to transform your data into a structure that is customized to your business - giving you the flexibility to build the system you need without the overhead of force fitting your business to some other paradigm.
Taking the first step - defining the business logic for ARR.
Now that we’ve chosen SQL as our source of truth, our next step is to define ARR. The goal of this exercise is to articulate one way of measuring ARR (as opposed to every team / analyst having their own version of this logic). We’ll later build this logic into our core ARR reporting table. Below are a list of starter questions to help you think through some of what you’ll need to implement. Every business is different - completing this exercise will require you to brainstorm an exhaustive list.
As you work through this exercise, remember that this business logic meaningfully impacts most internal stakeholders. As such, be sure to include others in the process. For example, Sales will care about how you define a new and churned ARR event. :)
Bring folks along, meticulously document your logic, and make the final articulation accessible.
Building your core ARR table!
Now we’re ready to start building the centerpiece table - the ARR timeseries. All of the business logic defined in the prior step is built into this table.
Start with a unique identifier for every paid instance of your product. For the purposes of this example, we call it the account_id, but it could be a customer_id, app_id, etc. What matters is that this '_id' shows up in (or can be added to) other data sets across the company (e.g. product and funnel data) because that’s how you’ll ultimately link your data together.
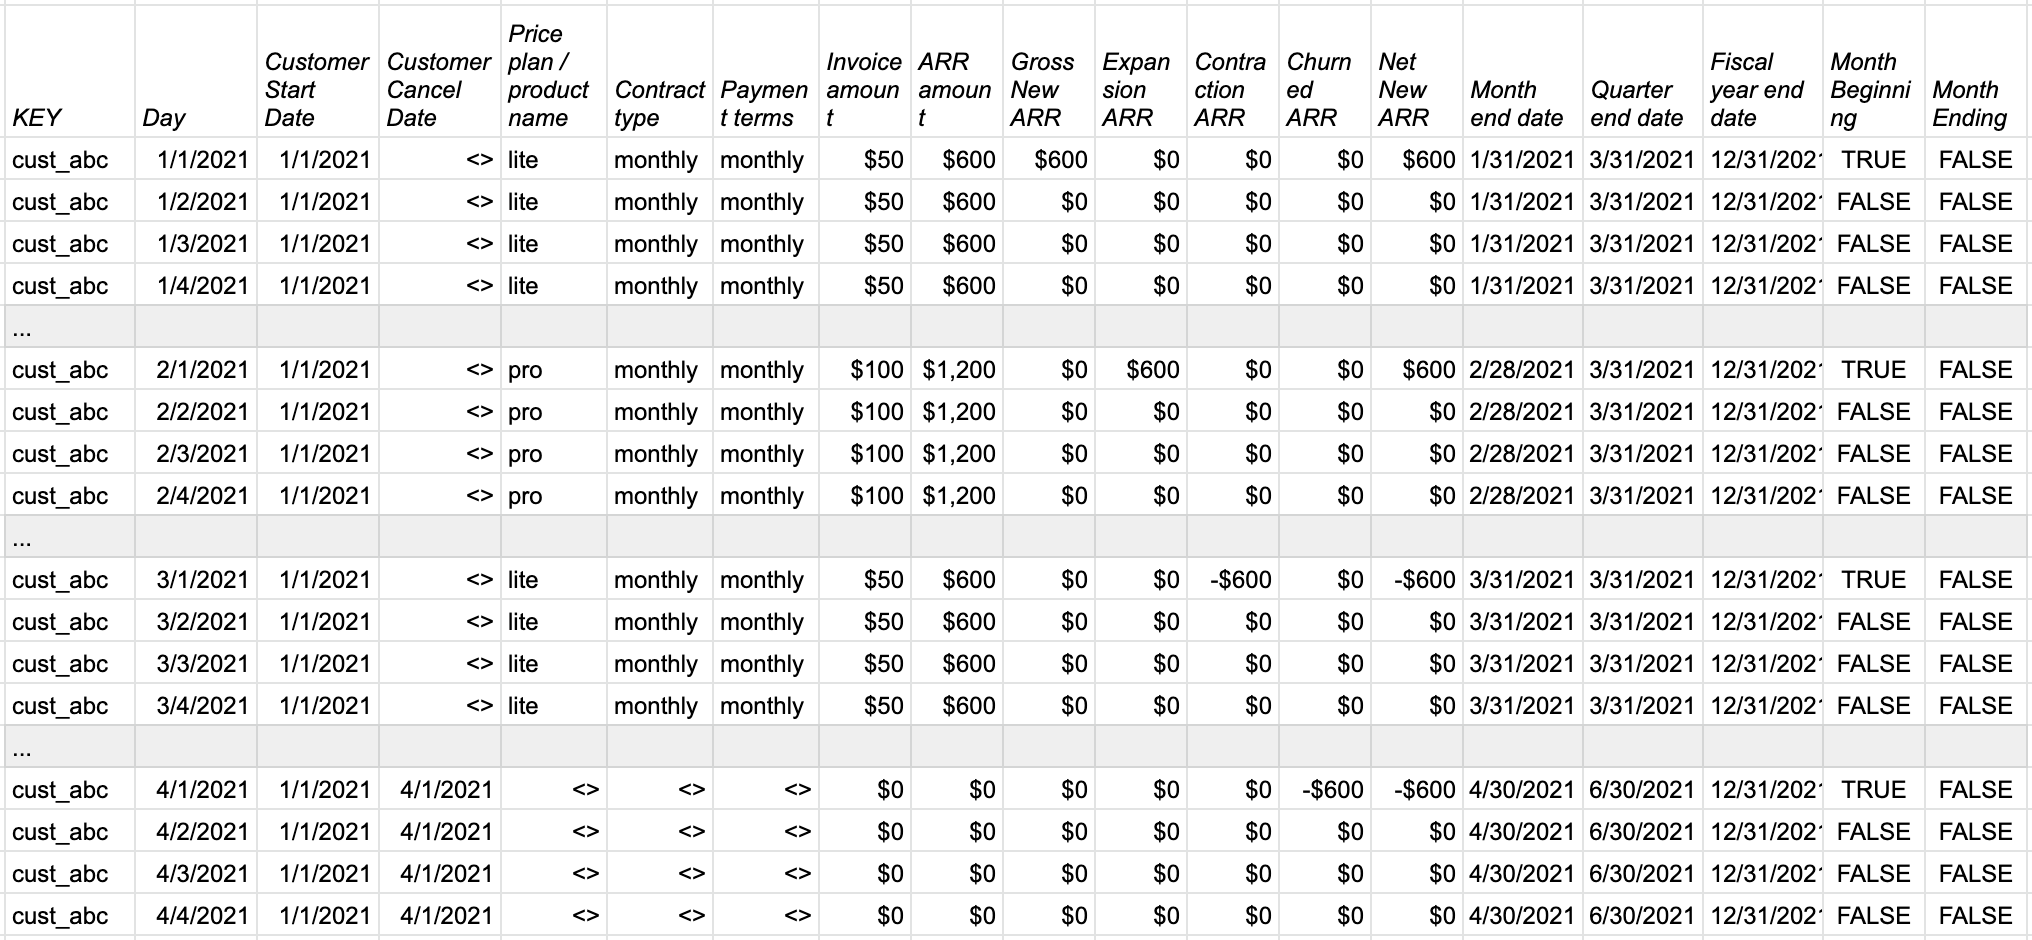
From there, below is the form our ARR timeseries table took at Intercom. We had many different versions of this table over the years, and where we ended up is certainly not the only way to construct a useful ARR timeseries table. However, of the many versions we tried, this ended up being the most flexible and easy to use. It’s repetitive, but that’s what makes it powerful!
Here’s a simplified example of what this would look like for a customer who signed up, expanded, contracted, and churned in the span of 4 months (I removed a few columns to make it more easily fit).
Getting organizational buy-in.
Your ARR timeseries is only as powerful as it is adopted across the company. The larger success of what we built at Intercom is not only a result of the structure of the ARR table, but is also a result of other teams consuming it as the foundation layer for their analysis.
Even at an early startup, your ability to drive awareness and adoption is critical to avoiding the mess described at the beginning of this post. Think about whoever else might need access to ARR data, take this table to them, and show them how to use it! In doing so, your goals are threefold...
First, get folks to throw away their old, bespoke ARR queries and converge reporting to your ARR timeseries. Second, get more contributors who can pressure test the integrity of the table - crowdsource finding bugs! Lastly, start to build context for all the most common reporting requests and pain points from other teams. Those discussions will ultimately inform the next step - your modular data sets.
Enriching ARR with modular datasets.
Think of a modular dataset as anything that can be used to enrich your ARR timeseries. For example, firmographic information about your customers could be a modular table. Acquisition data or product usage statistics are also examples of modular datasets you may want to construct. We thought about grouping modular data sets into similar categories and, as feasible, from similar data sources. Here are some tangible examples of modular tables to build.
Building discrete, modular tables that are grouped by category and data source makes debugging simpler. Because they are pulling from minimal data sources and are more contained, there’s far less code to parse per table. These modular tables can then be joined to your core ARR timeseries to create a comprehensive view.
MEGA ARR TABLE!
This is the final table. ‘Mega ARR table’ is a “flat” or “wide” table, and in it are all the columns from your ARR timeseries joined to your modular data sets. Repetition is intentional, as that’s what makes it easier to query. Now imagine being able to answer a question like: “how much of our gross new ARR last quarter came from B2B companies with 10-100 employees in Europe? And how does that trend look over time?” That’s a really simple query:
SELECT
    quarter_end_date,
    SUM(gross_new_arr) as gross_new_arr
FROM
    mega_arr_table
WHERE
    business_model = 'b2b'
    AND company_segment = '10-100'
    AND region = 'europe'
GROUP BY
    1
---
We’ve made it! A few concluding thoughts.
Every company’s journey through this process will be different. The process itself is rarely linear as we’ve described. For example, it’s possible that you might create components of your business logic and then your business changes. It's an iterative, never-ending process. Similarly, everyone’s ARR timeseries and modular datasets need to be considered and customized to their specific business. No two will look exactly the same. Therefore, please don’t treat this as a literal, prescriptive guide on what exactly to build. Instead, our intent is to create a guiding framework with real examples of the considerations we made, to get to an effective ARR source of truth.
Finally, we’ve thought quite a bit about why this continues to be an issue at most companies. At its core, we believe there’s a shortage of folks who deeply understand the business requirements for ARR reporting who can also think through how such a system is architected in a SQL. We maintain that everyone in finance, analytics, and operational roles should learn SQL. It’ll make you 10x better at your job.
Happy building, and please don’t hesitate to reach out to us. We’d love to learn and help as you build your own version of ARR reporting.

By Chris Burgner
Chris is a currently a Director of Finance at Intercom, where he leads the FP&A Business Partner teams.
