How we forecast ARR
Chris Burgner | | 5 min read
Given everything we measure at Equals, let’s unpack how we forecast Annual Recurring Revenue (ARR).
Our methodology
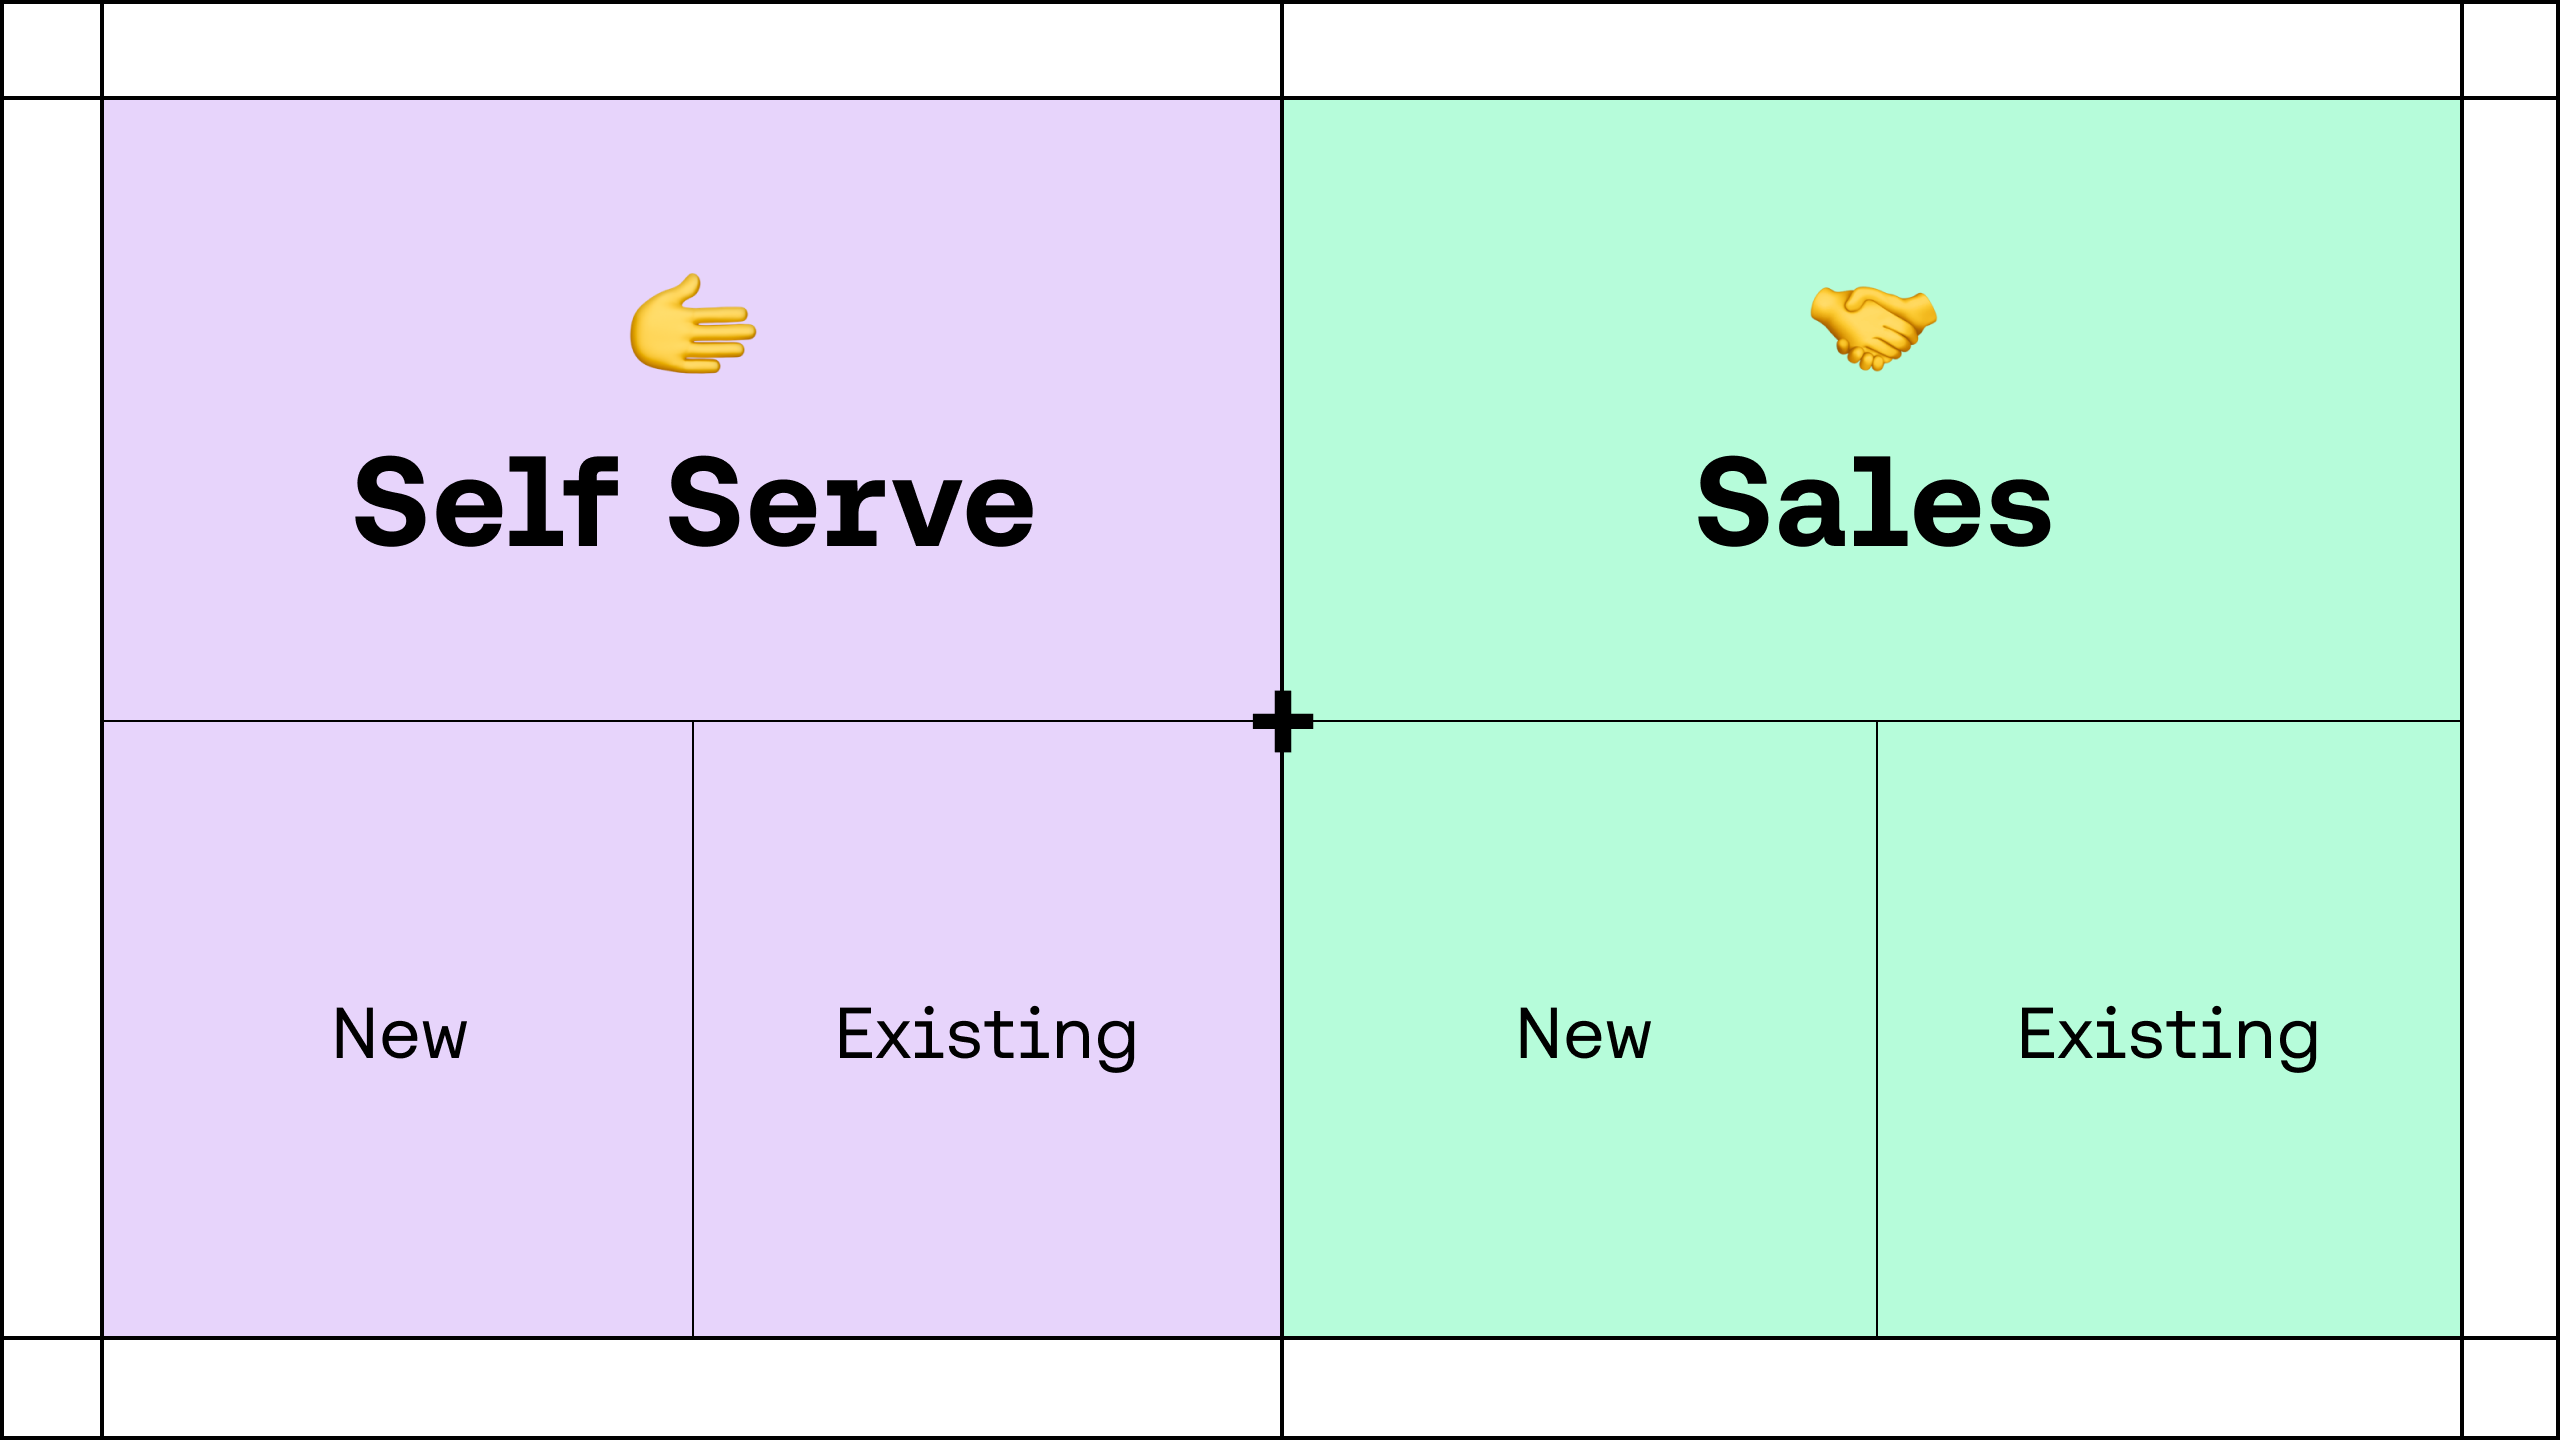
We start by breaking the business down by Go-to-Market (“GTM”) motion – Self Serve vs. Sales. And splitting each by New vs. Existing business.
As your business scales, you may consider forecasting by dimensions like customer segment or geography, but I recommend keeping things simple initially.
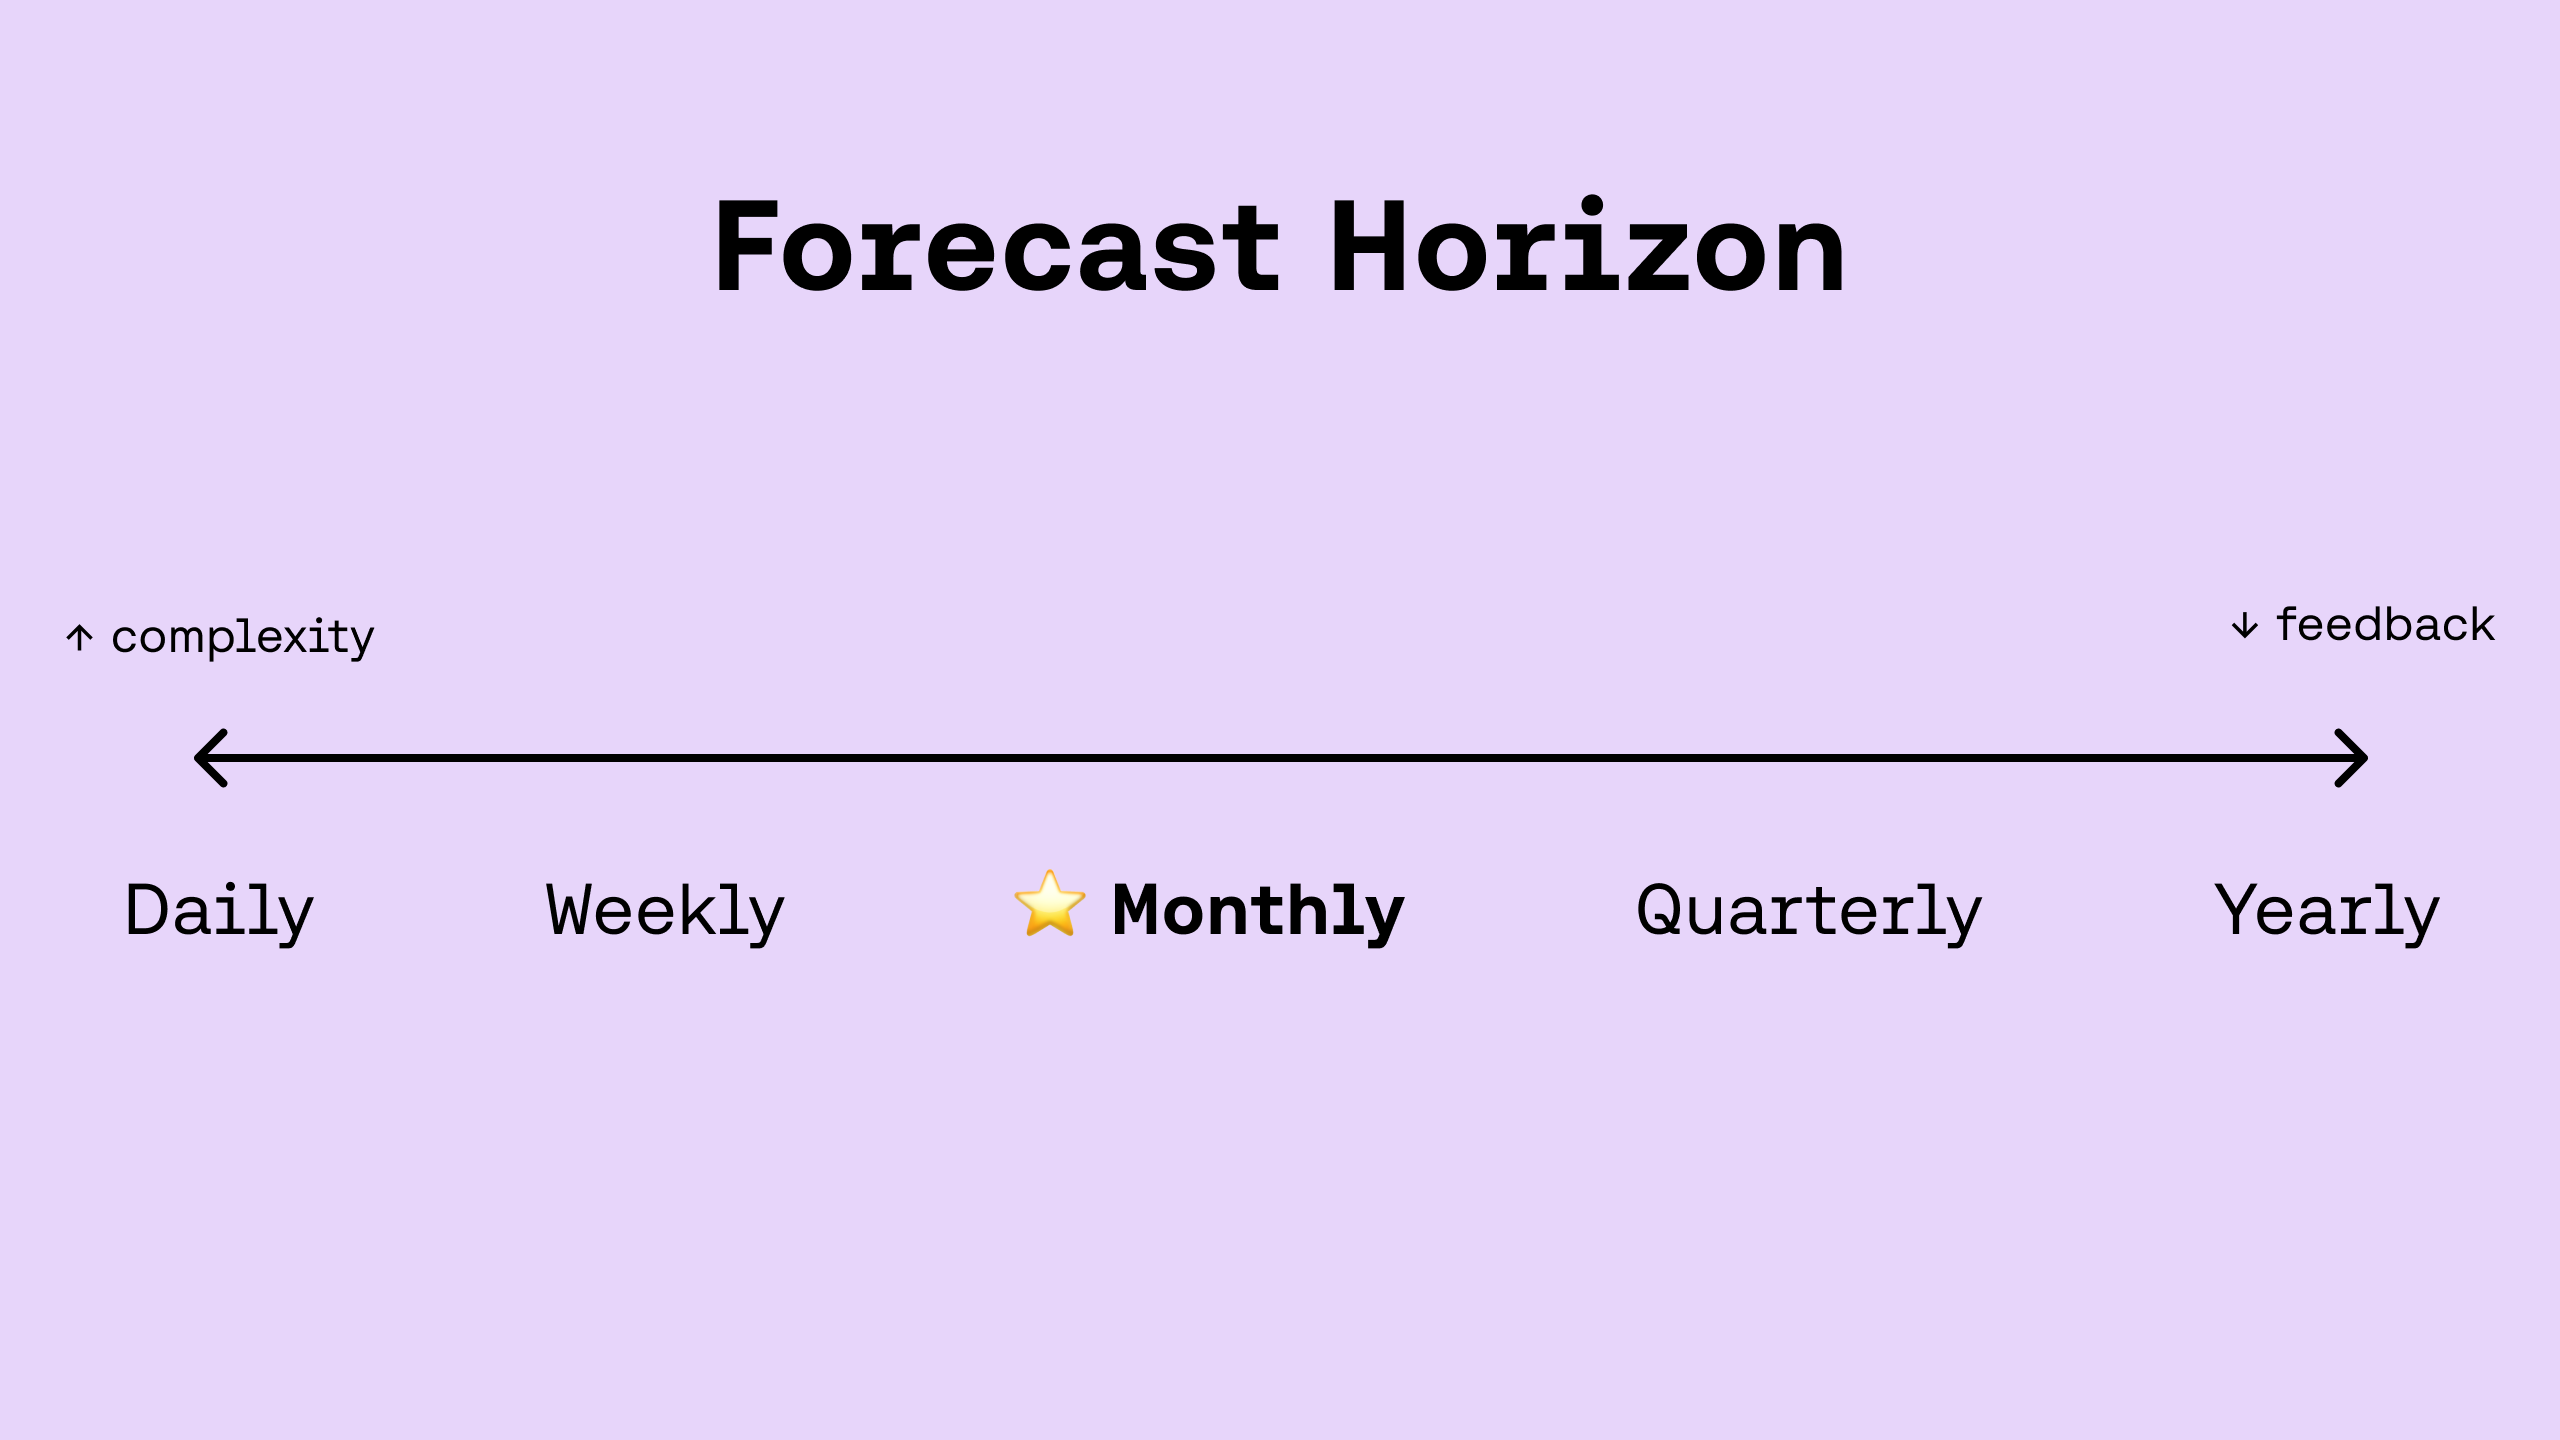
All forecasting is done on a monthly horizon. Anything shorter creates too much complexity, and anything longer is too slow because, as an early-stage company, our business is constantly evolving.
Before we dive in, note that all the data you see below is dummy data. 😅
Self Serve ARR
Ask three companies how they draw the line between Sales and Self Serve, and you’ll get eight different answers. Given that, the only thing that matters is ensuring the business definitions align with the incentive structure of the operational teams (i.e. Marketing/Growth and Sales).
For us, Self Serve is ARR from customers on month-to-month subscriptions. Even though we route ALL inbound leads to sales, quota is only retired when a customer signs an annual contract, which can only be done by working with a sales rep.
1. New Business
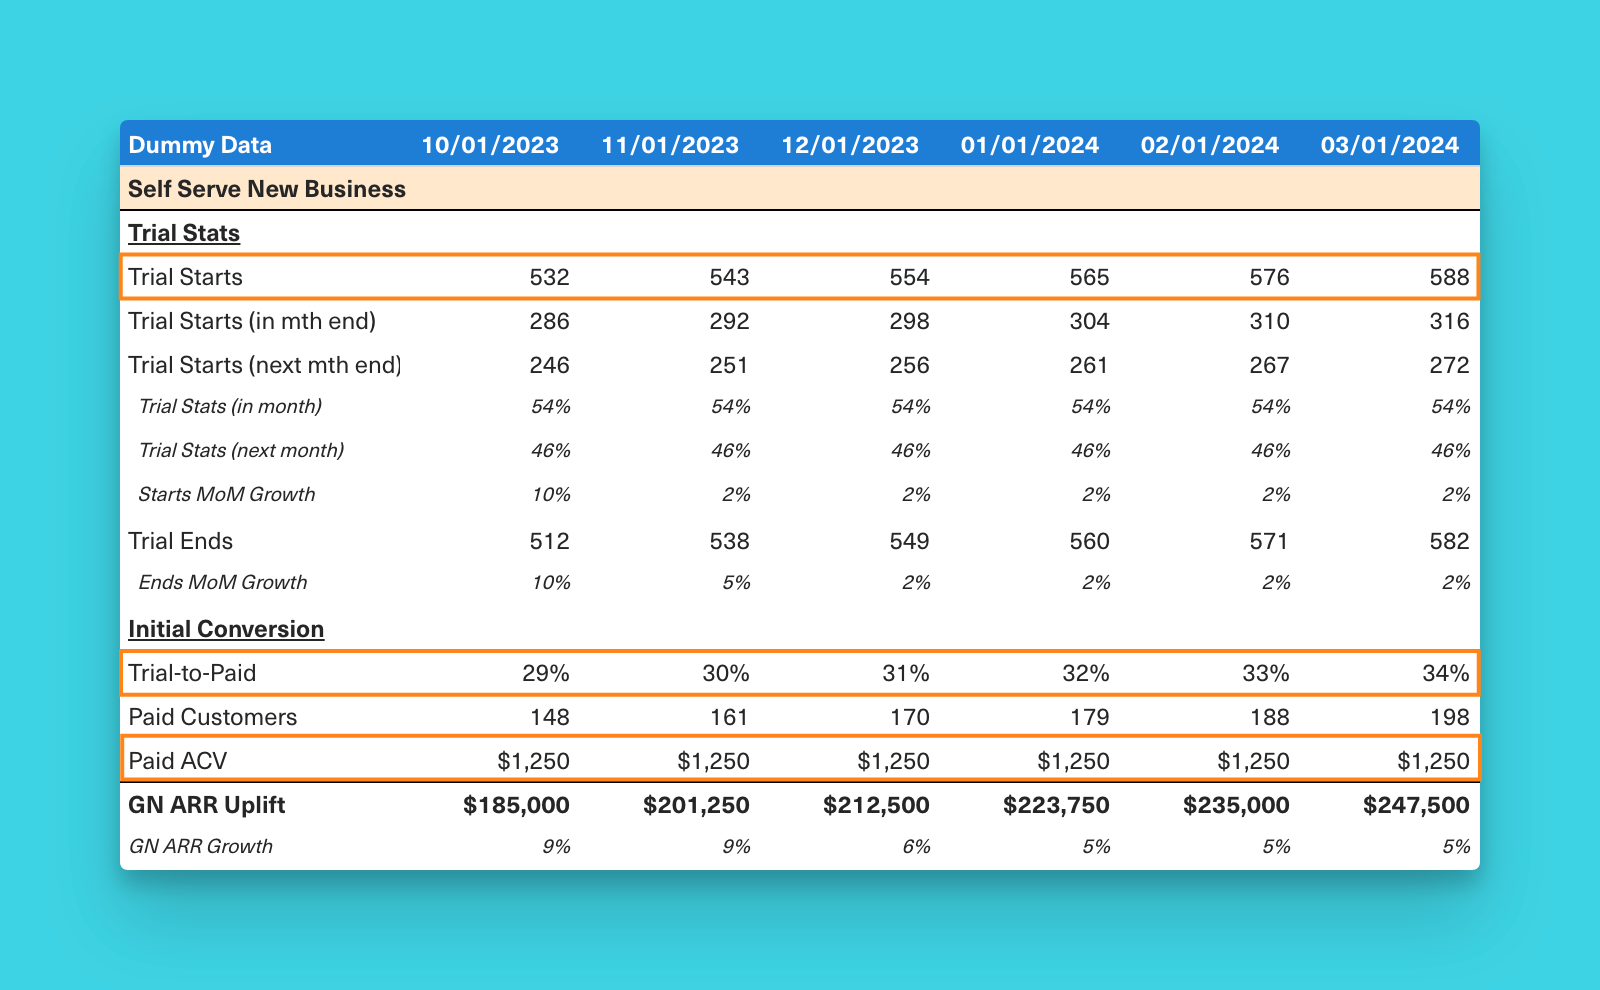
In June, we killed freemium and started offering a 14-day free trial of our paid plans. Trials are now the North Star metric for our Marketing team and the first driver to the Self Serve forecast. Because trials last 14 days, it’s important to break down which of the trials are set to convert to paying customers in the same or following month.
We closely monitor trial-to-paid conversion (second driver) on a weekly and monthly basis to stay on top of any movements in performance, like spikes in failed payment rates or impact from big product launches.
Annual Contract Value ("ACV") is the final driver but tends to be more stable we have fewer SKUs and pricing options available on month-to-month subscriptions.
Below is an example output with the drivers highlighted in orange.
2. Existing Business
As shared in Everything we measure at Equals, uplift in the Existing Business is calculated as the sum of:
➕ Expansion
➕ Restart ARR
➖ Contraction
➖ Churn
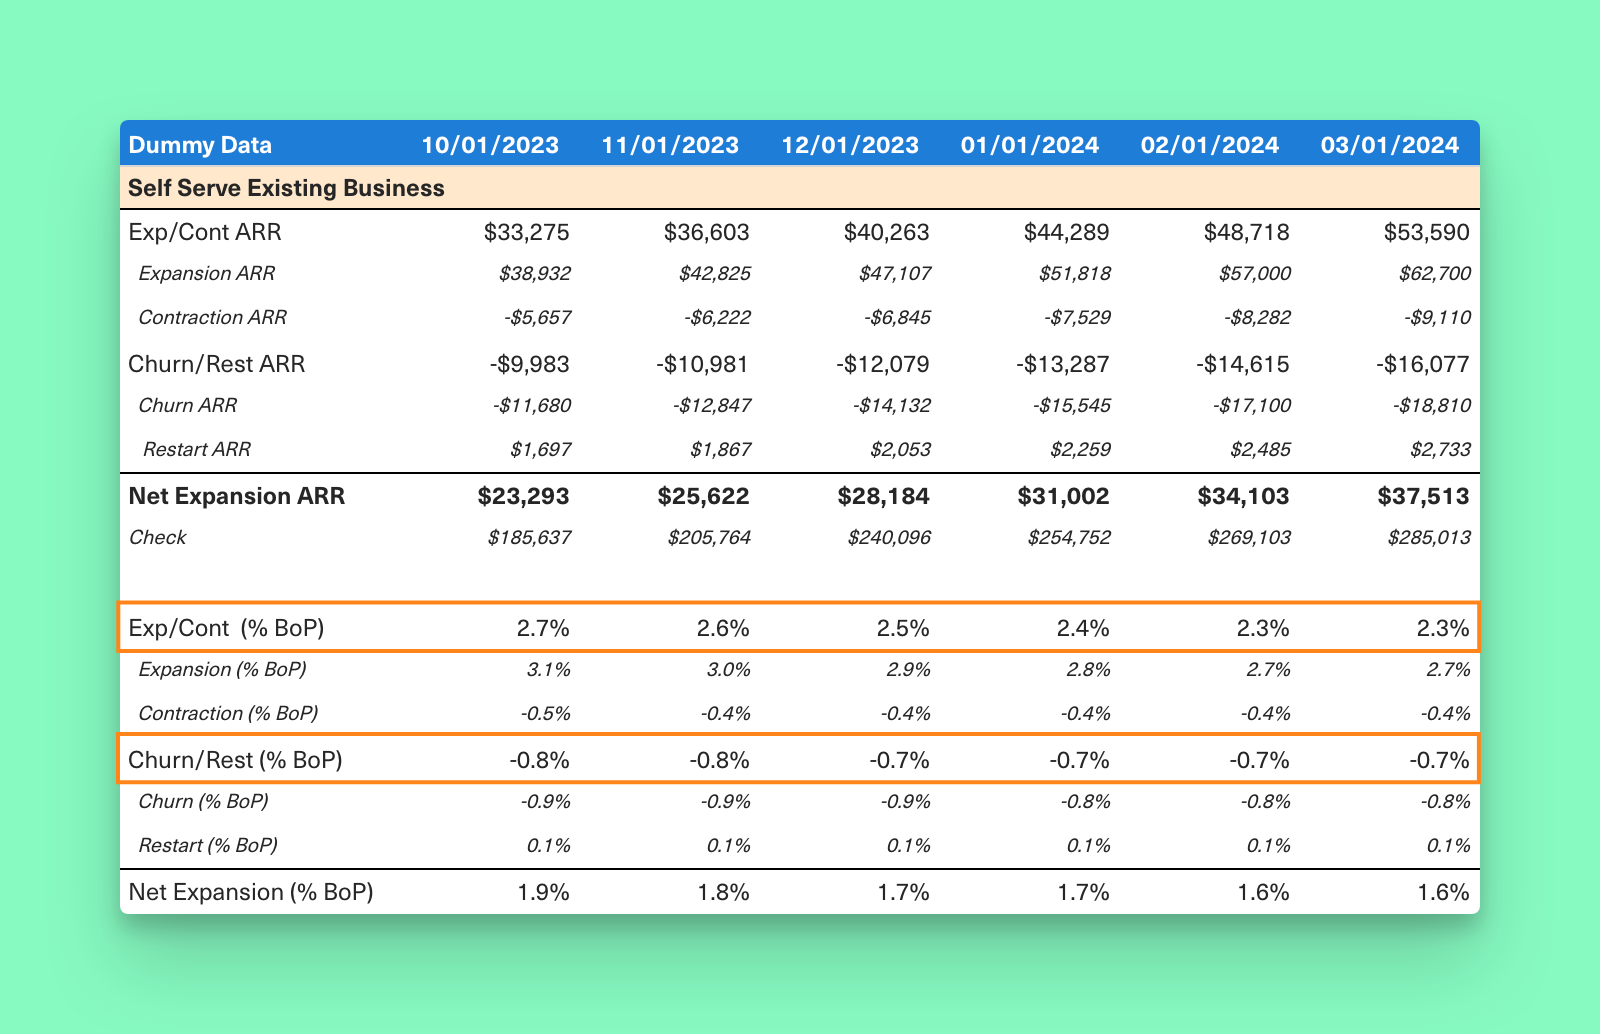
Trying to accurately forecast each line item can be tricky at any stage, especially when your customer base is smaller. To get around this, we combine Expansion+Contraction and Churn+Restart and compare that against the total Self Serve ARR at the beginning of each period (“BoP ARR”). We use the calculated "% BoP" rates as drivers for the existing business to better contextualize relative movements as the size of the overall install base grows over time.
Below is an example output with the drivers highlighted in orange.
Down the line, we’ll move to forecast on a cohort basis similar to the methodology explored in our post on Figma’s Self Serve Forecast.
Sales ARR
As a quick reminder, Sales ARR comes from annual subscriptions, which can only be purchased by working with a sales rep.
1. New Business
Our Sales forecast is derived from a top-down method that measures the total open pipeline cohorted by close date multiplied by the rate at which those deals tend to close.
Because we have shorter sales cycles, we also assume some amount of ARR uplift from deals that are created and closed in the same month.
Below is an example output with the drivers highlighted in orange.
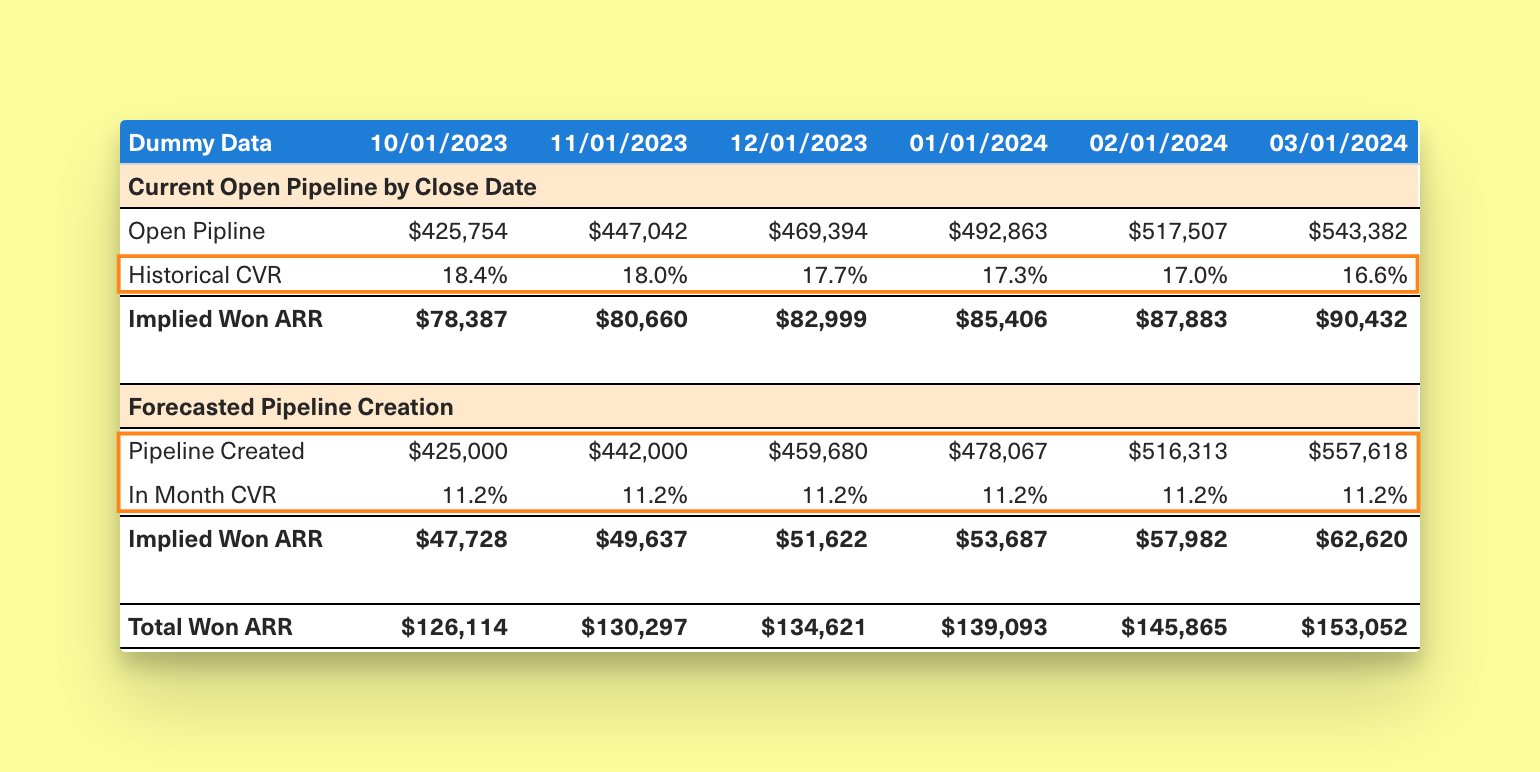
In addition to the top-down method described above, we also do weekly deal reviews with our sellers to better gauge the likelihood of larger deals closing, as those can have an outsized impact on the forecast.
2. Existing Business
Because our Sales motion is relatively new (<1 year as of this writing), Existing Business makes up a smaller portion of our overall forecast and is intentionally kept less detailed.
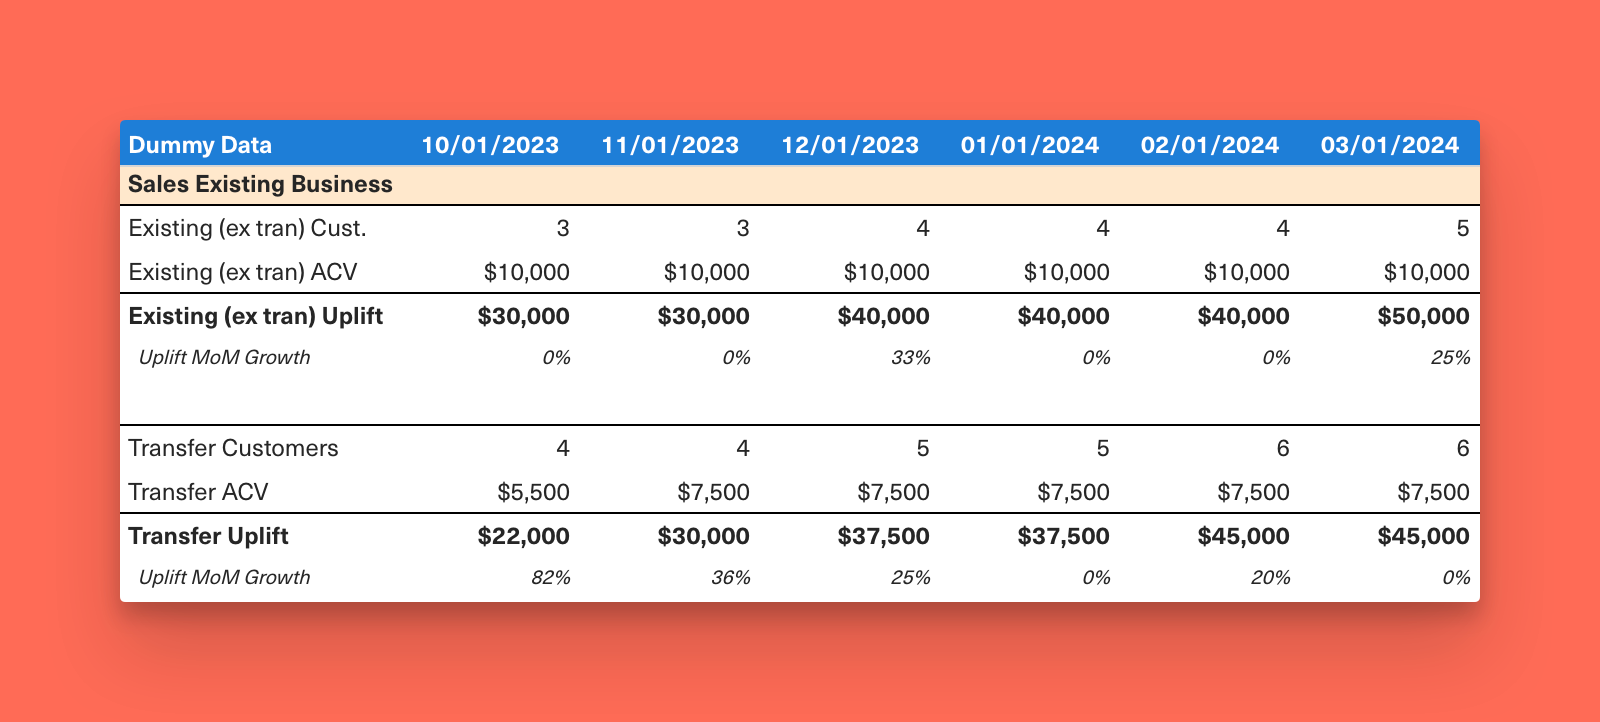
First, we model out the number of upsell/cross-sell deals we expect to see based on recently closed Sales New Business deals. Next, we make an assumption on month-to-month customers from our Self Serve business converting to annual contracts, which we call “Transfer” deals.
These opportunity types tend to be quick close deals and are not identified in the pipeline until the month (or week) the deal closes. As a result, we’ve found the cleanest way to forecast is by assuming a conservative growth rate on the number of these deals that have closed in prior months multiplied by their average upsell.
Below is an example output where both customer and ACV inputs are drivers.
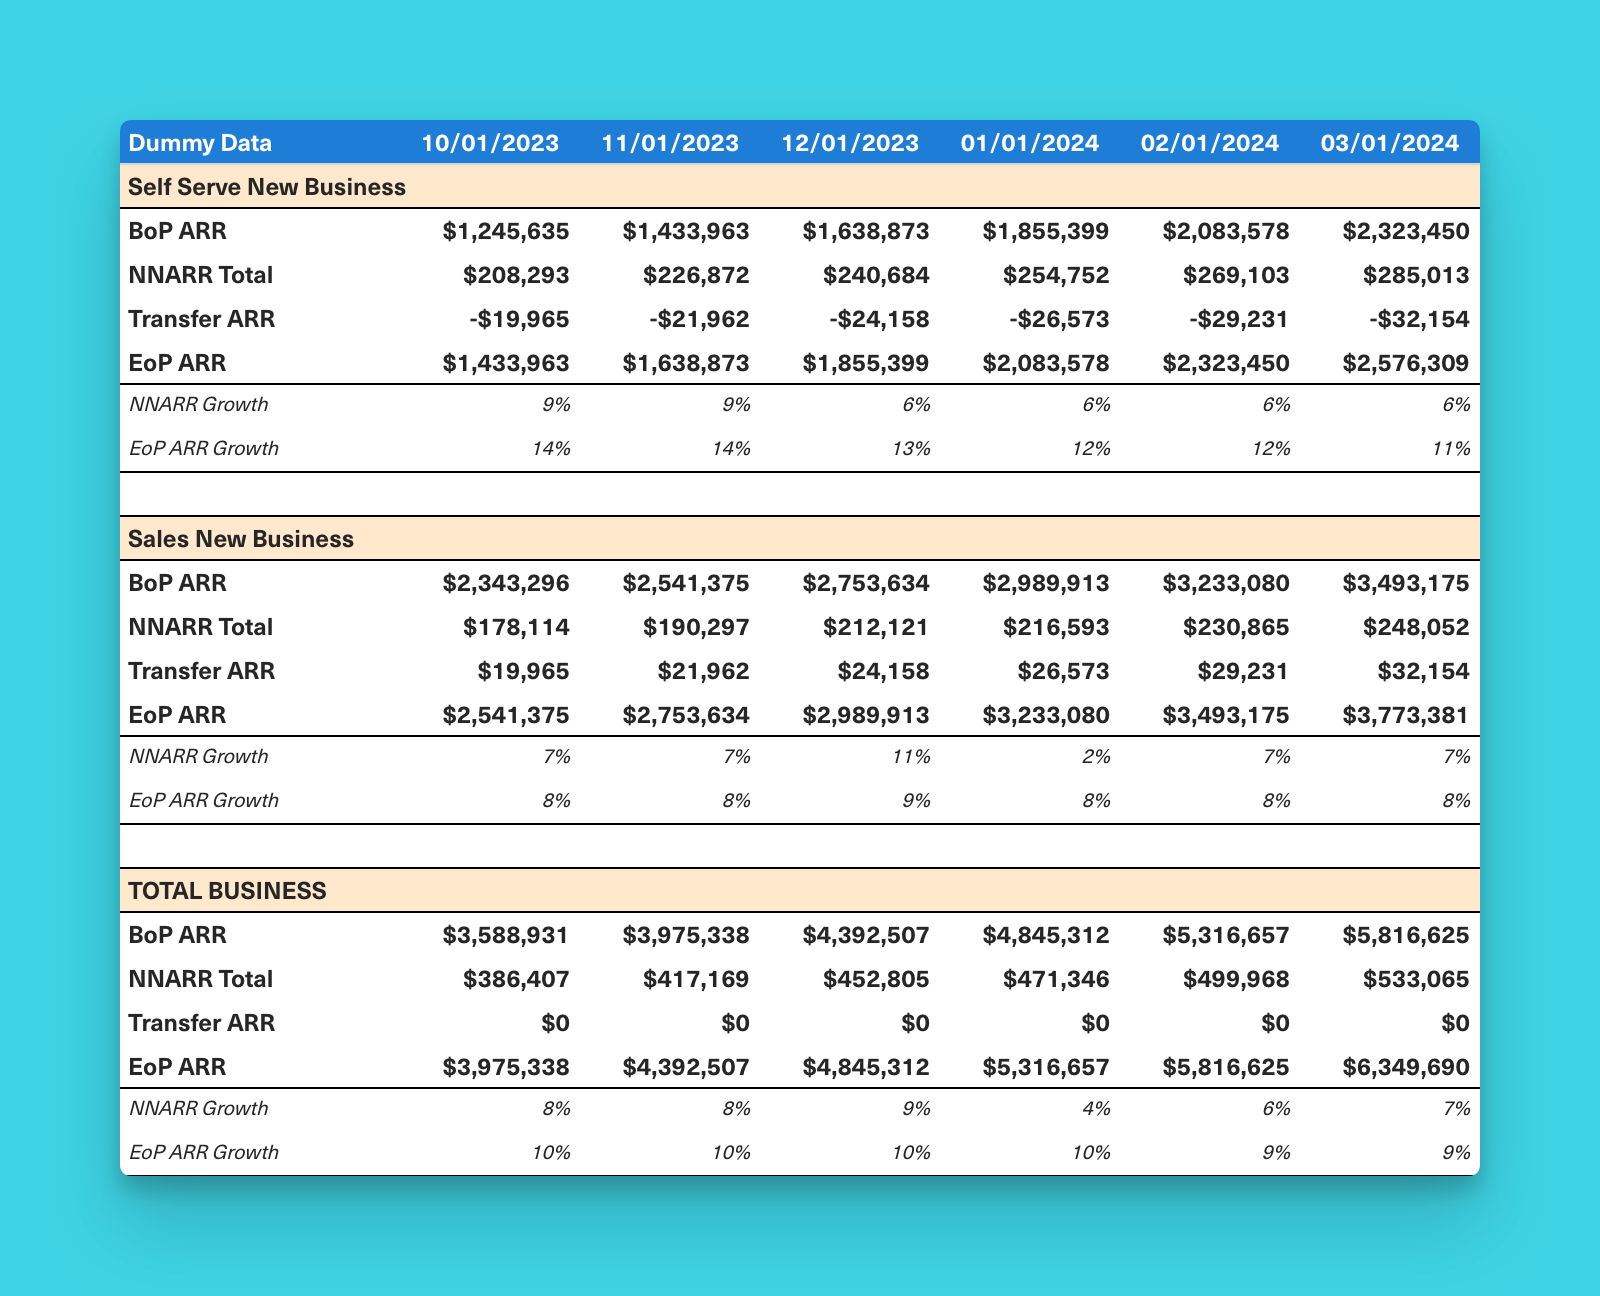
Self Serve + Sales ARR = ARR Forecast
Pulling all this together helps us see the monthly build of the business.
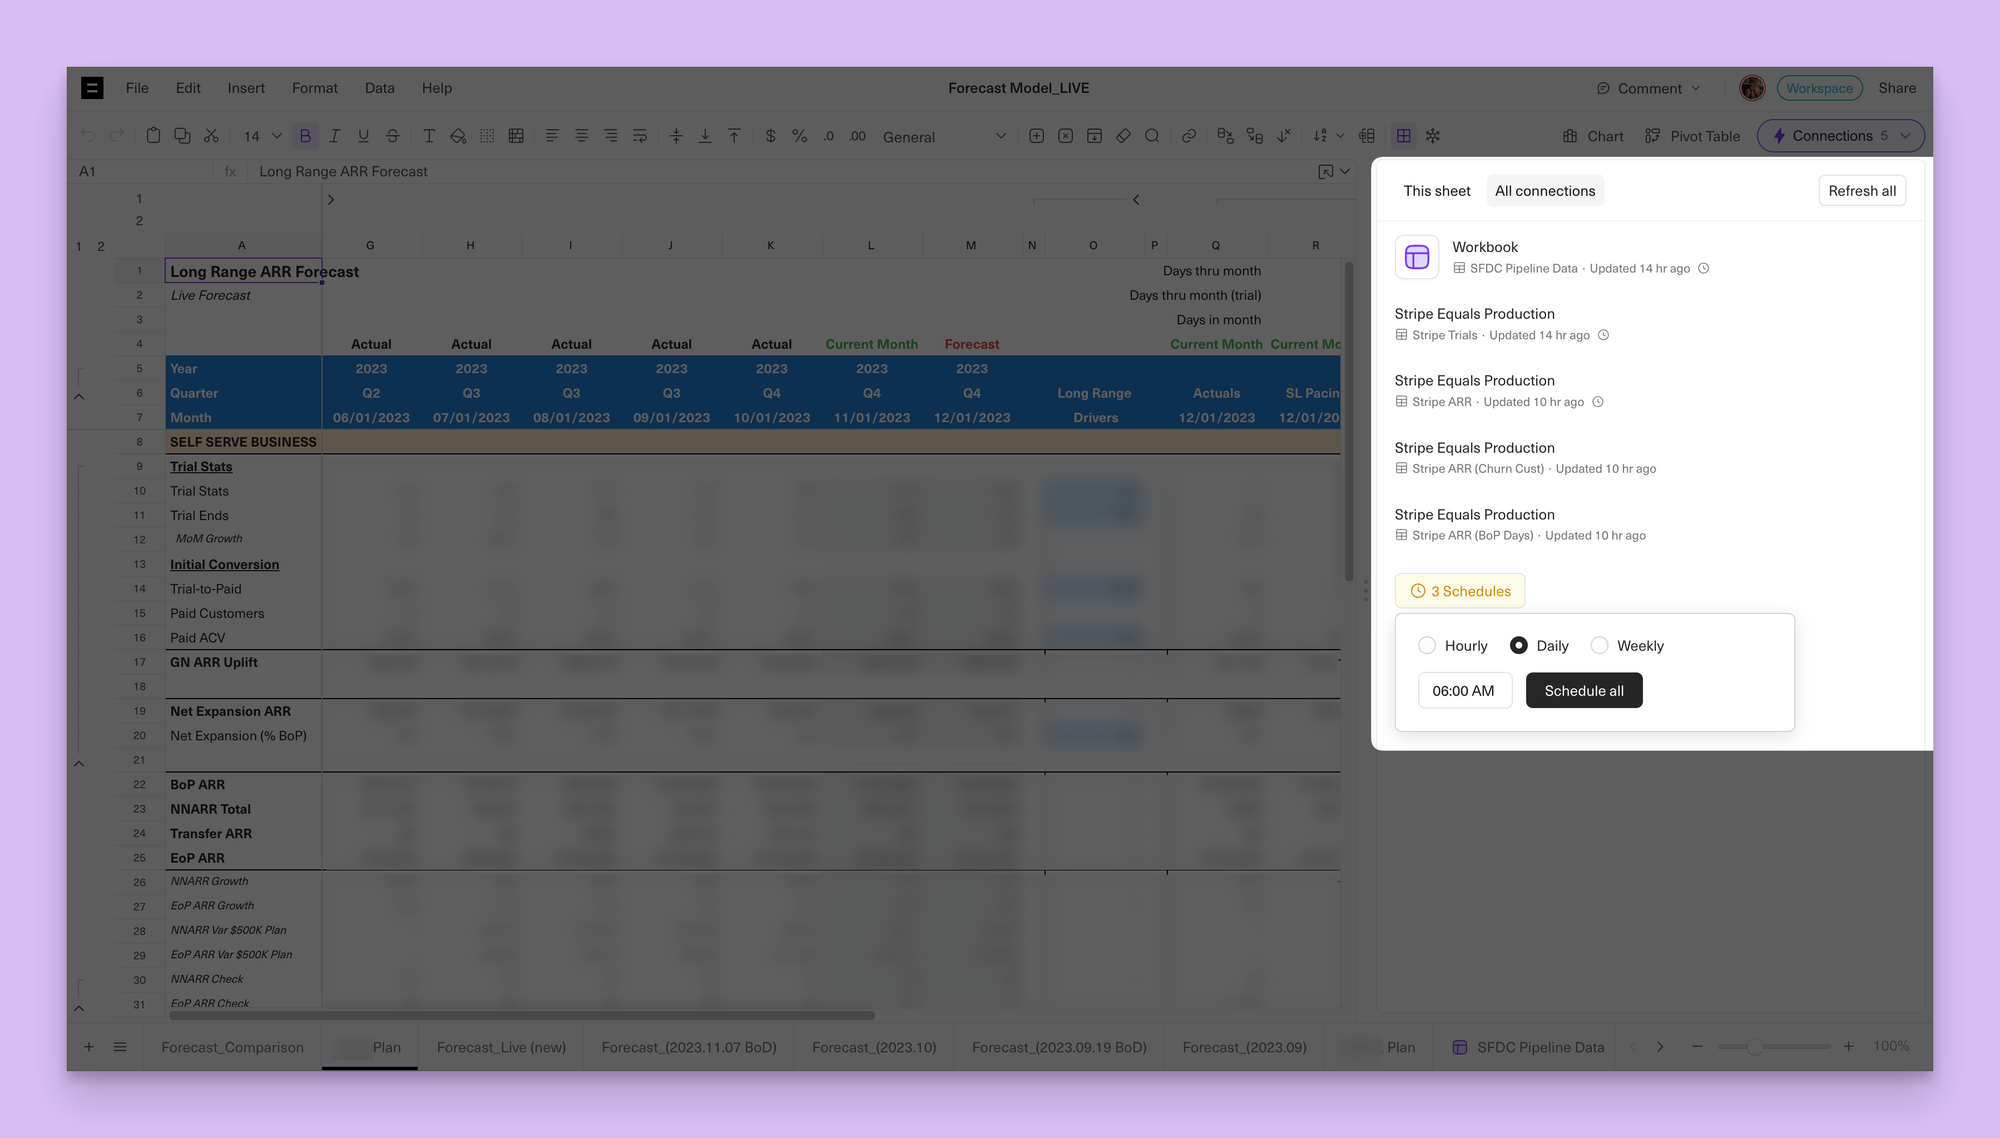
Naturally, we do all of our ARR forecasting in Equals using live data pulls from Stripe and Salesforce. As a former investment banker, and power user of spreadsheets my entire professional career, I couldn't imagine life without a Microsoft Office license but Equals makes that possible.
Check out our ARR from Stripe template to get started.
Parting advice
I'll leave you with two reflections:
1. Fewer inputs = more accurate forecasts
The accuracy of a forecast tends to be inversely proportional to the number of inputs or drivers. Many people make the mistake of trying to get too granular and end up losing the forest through the trees.
2. Shift from predicting to shaping
The exercise of forecasting isn’t useful to the rest of the business in a vacuum. You need to find ways to share your findings and transition from predicting the future to helping shape it. Have regular check-ins with leaders to make them aware of trends and be a partner in helping them come up with action plans for how to impact results going forward.
Happy forecasting. 🔮

By Chris Burgner
Head of Finance & Analytics at Equals

