Snowflake’s Forecast Transformation with Brad Floering
Chris Burgner | | 12 min read

Operator’s Dilemma Series
Every company leverages a shortlist of models and workflows to run their business but the stories behind their development are often the best kept secrets in the industry.
We're excited to continue our Operator’s Dilemma series where we go behind the scenes to share insights from the best builders and operators in tech.
Insights We’ll Uncover
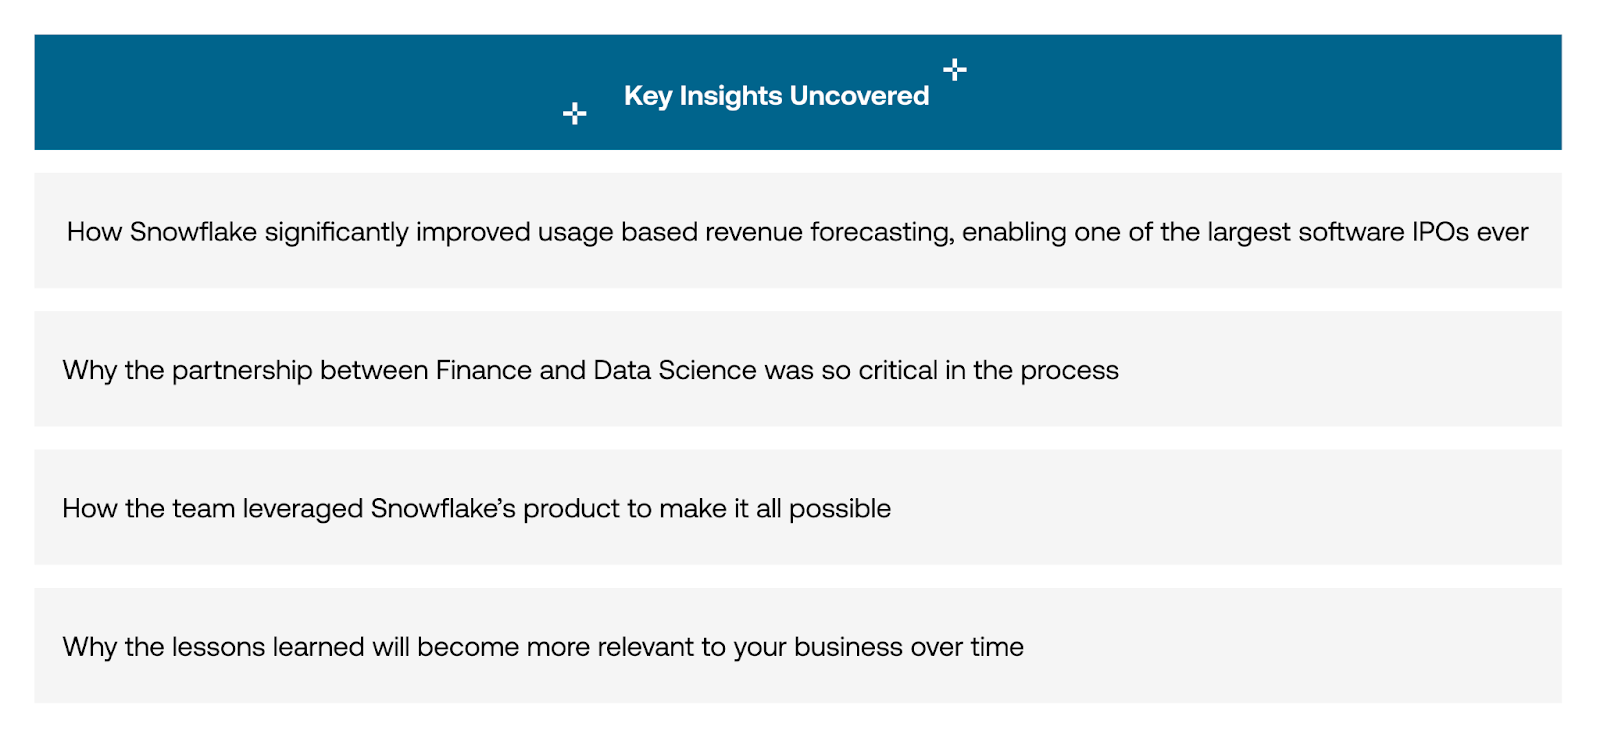
Snowflake’s Forecast Transformation
Snowflake is one of the fastest growing software businesses of all time. From its founding in July 2012, the company has grown to over $2B in annual revenue across 7,800 customers as of January 31, 2023(1). It achieved this success through an unstoppable combination of an industry defining product and being a very well run company.
Across the organization, Snowflake has succeeded in mastering complex workflows. CEO Frank Slootman has summarized this relentless pursuit as “declaring war on mediocrity.” Said another way, Snowflake strives to be world class in everything it does.
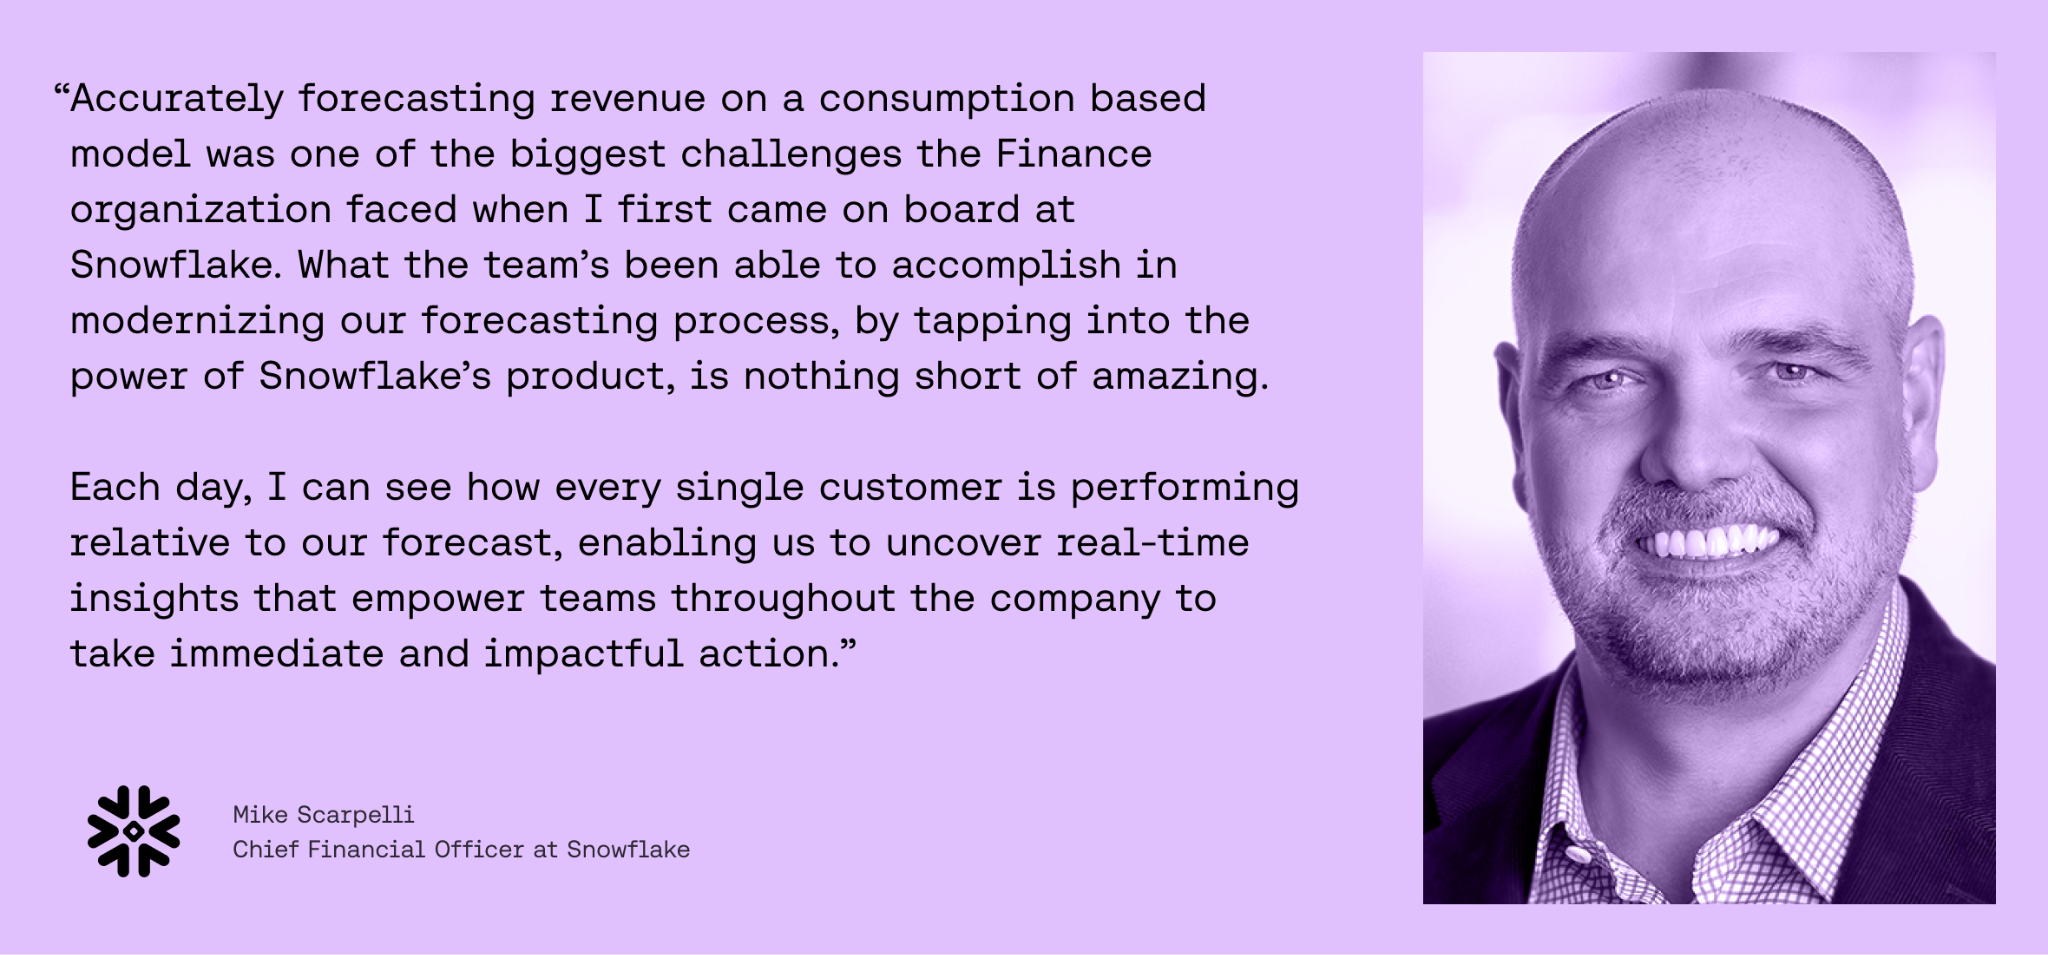
One example of this operational rigor is how Snowflake cracked the code on accurately forecasting a usage-based pricing model, something few, if any, have nailed.
We sat down with early Finance leader Brad Floering to learn how he leveraged Snowflake’s own product to radically transform the company’s forecasting process and helped make one of the most successful IPOs in technology possible.
Challenges Facing the Early Finance Team
When Brad joined Snowflake in September 2017 he was tasked with building out the FP&A team and owning P&L forecasting. The company, with around 300 employees, had just raised its Series D financing and had not yet reached $100M in annual revenue but it was obvious, even then, that Snowflake was on to something special and would need to start laying the foundation to operate as a public company in the coming years.
As Brad started digging in on the forecast side, a big problem was staring him in the face: the current way of forecasting wasn’t working. Each quarter, the team’s forecast missed by over 20%, and he quickly identified three reasons why.
Issue #1 usage-based Pricing - Exponential vs. Linear Growth
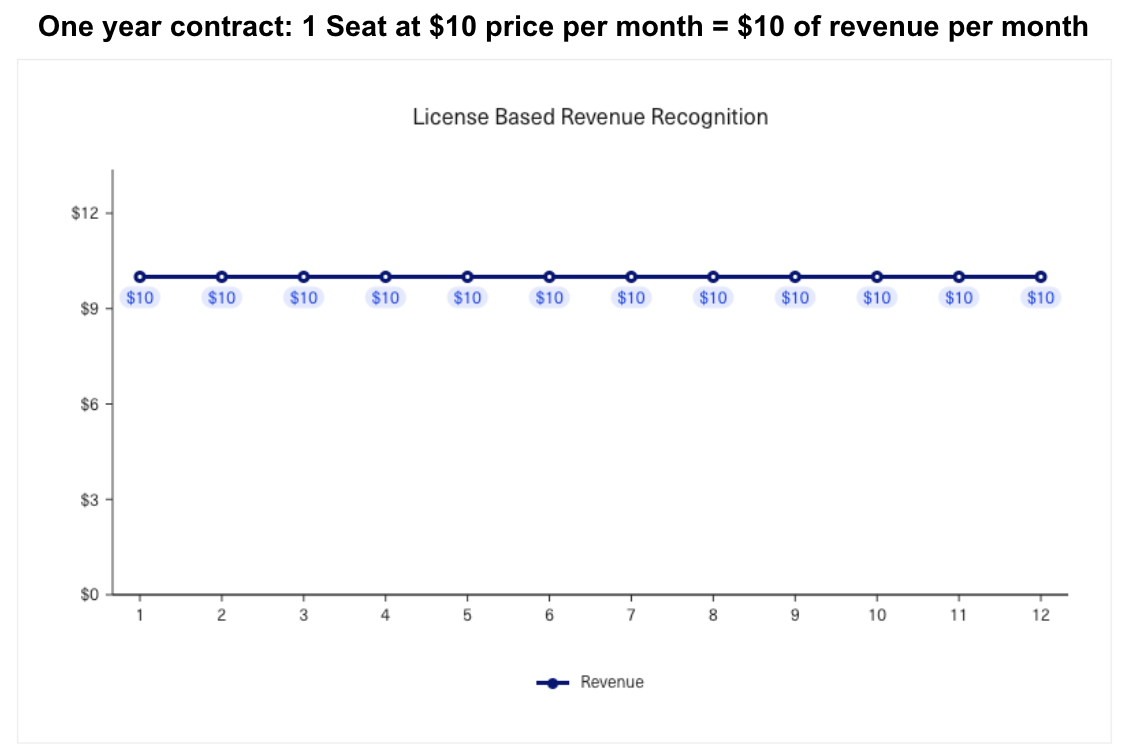
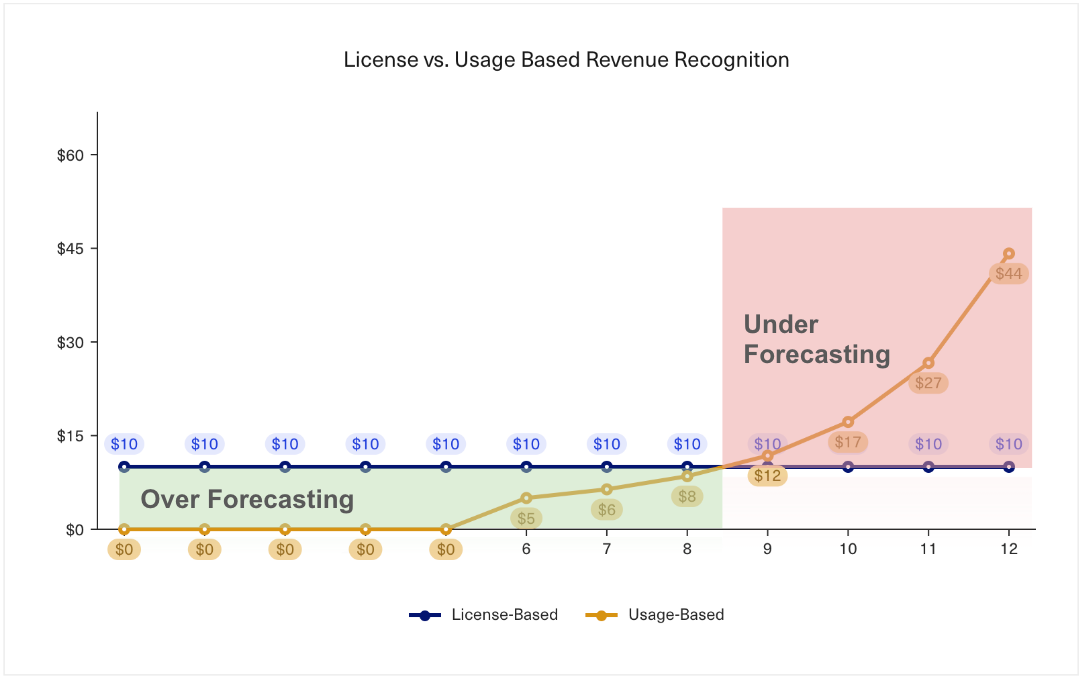
It's pretty well understood that forecasting and recognizing Revenue on usage-based pricing is inherently different from a traditional seat-based model. In a seat-based model, a customer commits to pay for a fixed number of licenses over a defined period of time. Because the number of seats purchased and the duration are both known at the time of booking, Revenue can be recognized in equal installments throughout the year. The team was leveraging this seat-based recognition method when Brad joined.
However, Snowflake charged customers on a usage-based model that looked quite different. In order to accurately forecast Revenue, you have to understand the consumption behavior of the customer over the contract period. Brad found that customers on usage-based plans follow a more geometric consumption curve which resulted in the team over-forecasting in the short term and under-forecasting in the back half of the contract period compared to a seat-based model. The latter point was especially true as customers tended to exceed their initial usage commitments after seeing what Snowflake’s product could do, migrating as many workloads to the platform as possible.
Issue #2 The Cold Start
Revenue forecasting, while still challenging to predict for any business, becomes easier when you have years of historical data on customer usage patterns. But what happens when a brand-new customer signs up? With no historical data to rely on, forecasts can feel like a shot in the dark. This brings us to Brad’s second problem, which was referred to as ‘the Cold Start’ internally: how can you predict consumption behavior, which drives Revenue, for customers who have never used your product before?
The Cold Start proves particularly challenging with usage-based pricing, as the speed and scale of adoption among new customers varies from customer to customer.
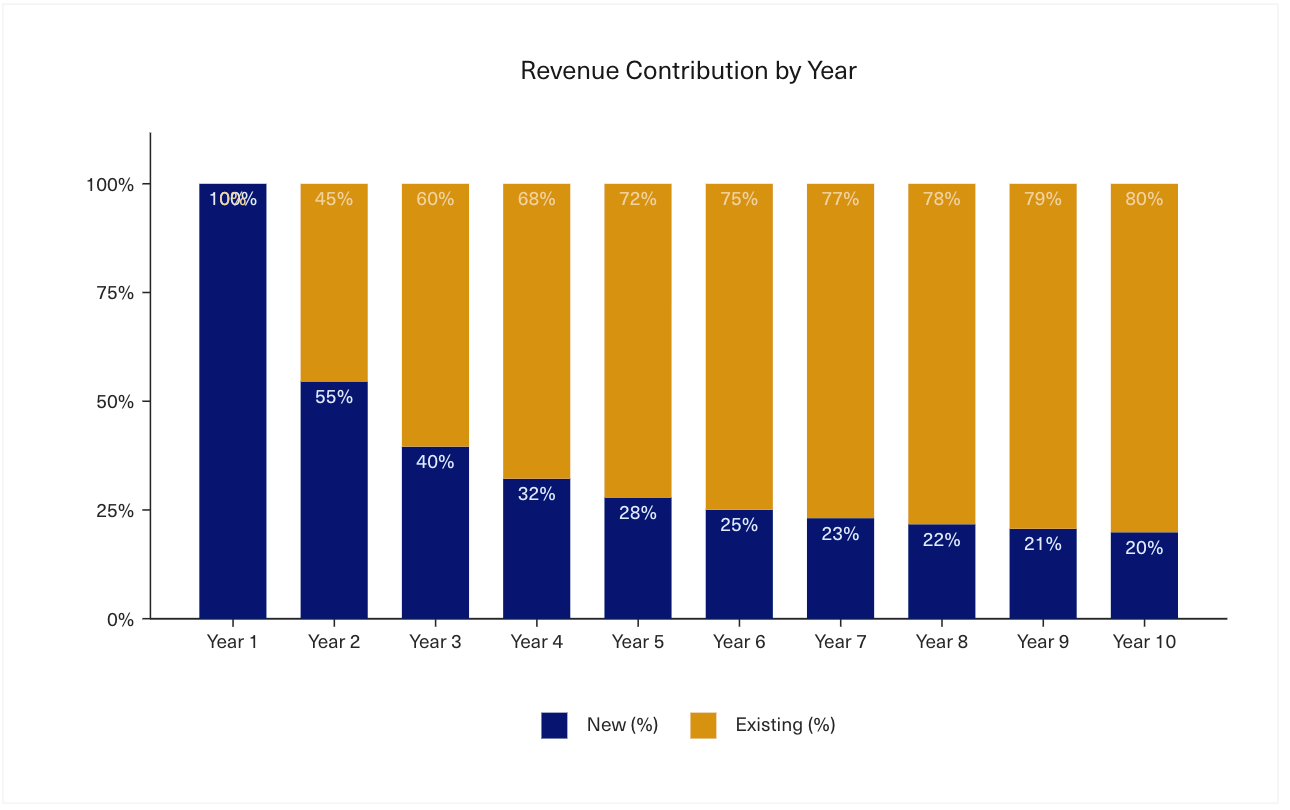
Issue #3 Revenue Contribution: New vs. Existing
The third factor is one that any new software startup experiences: in the early days, the majority of the company’s Revenue came from new customers. As the customer base grows, the balance eventually shifts more towards existing business, but this presents a unique challenge for companies in their first several years in business. To produce an accurate forecast, you need to nail down the usage patterns of your whole customer base — even if many of your customers are new. Below is a representative chart of what this looks like for many early stage companies.
These problems needed to be solved if Snowflake was to overcome its issues with forecasting and put the company in a position to IPO.
The Search for a Solution
Once he understood the problems, Brad started to seek advice from investors, mentors and even peers at mature cloud service providers. To his surprise, no one seemed to have quite cracked the code on usage-based forecasting, so he set out to build his own model from scratch.
The war against mediocrity was on and would eventually require a masterclass in collaboration with Data Science and leveraging Snowflake’s own product to succeed.
Early Approach
Brad started by building a cohorted model that would forecast usage on the same non-linear, or “curved”, schedule across all customers based on age (for an example of how to build cohorted models see our story on Figma’s Self Serve Forecast). This helped, but a single curve proved too imprecise. To further refine the customer base, he created groupings by a handful of attributes including: number of employees, initial contract size, industry and sales segment.
Eventually, he settled on a 4 curve model that shrunk the forecast error from over 20% to the high teens in a customer’s first year. An improvement, but not good enough as usage after Year 1 varied widely.
Data Science & Finance - a Masterclass in Collaboration
Eventually, Brad realized the skill set needed to solve the problem didn’t exist on the team. He looked for someone with deeper knowledge in statistical modeling and experience working with large datasets in Python, SQL and R and in April 2018 made Finance’s first dedicated Data Science hire with Andrew Seitz.
Mapping out the Journey
Andrew and Brad started by sketching out a framework that could forecast usage across the customer’s entire lifecycle.
A Three Model Approach
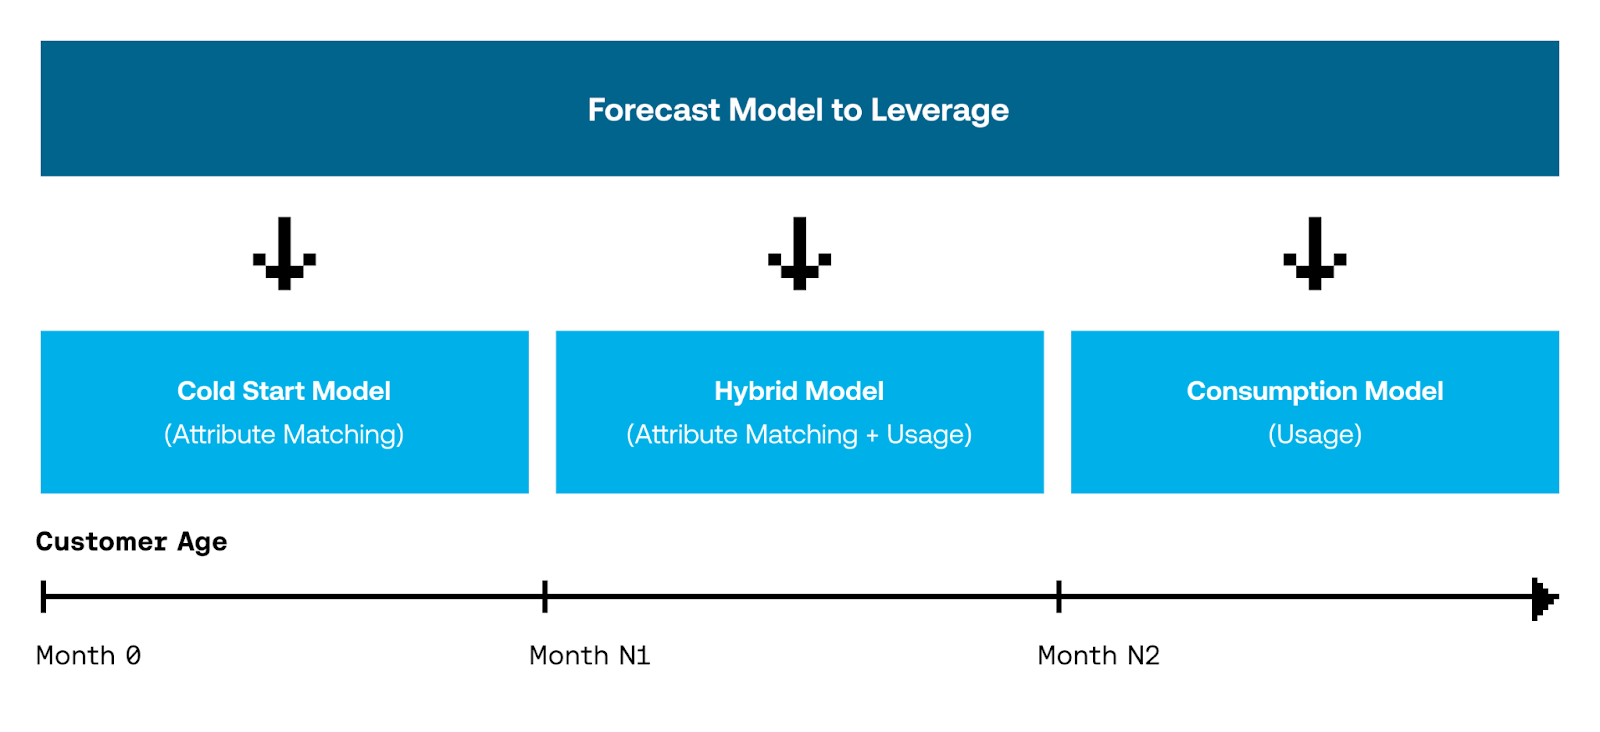
It was clear the team needed a way to forecast usage both before actual data existed (i.e. the Cold Start) and after a customer became active on the platform. However, the method for modeling each was entirely different.
After some brainstorming, Brad and Andrew decided to pursue a framework that would forecast the usage for each individual customer through a combination of three statistical models: the Cold Start, Hybrid and Consumption models. The decision of which model to use was determined by the customer’s age at the time the forecast was generated.
Newly acquired customers would be placed on a Cold Start model that forecasted usage-based on consumption patterns of previous customers sharing common attributes. A Hybrid model would be leveraged for customers who were still early in tenure but had some usage to train a model on. Finally, customers with enough time on Snowflake’s platform were forecasted through a Consumption model trained exclusively on the customer’s own usage.
The Forecast Output and Cadence
The last step in finalizing the framework was aligning on the output of the models and cadence for generating new forecasts.
Because Snowflake’s pricing was based on a customer’s cumulative monthly usage, that meant each day of consumption mattered in determining how much they would ultimately be charged. By generating the forecast at the day-grain, the team would be able to compare the forecast vs. actual results as they rolled in each day. This enabled them to take action at an individual customer level as soon as variances emerged.
Brad also needed a way to dynamically rerun the forecast throughout the quarter, using the most current usage data, to inform whether the team’s original forecast was at risk. Applying similar logic here, Brad and Andrew decided that rerunning the forecast each day would allow them to monitor any performance swings that could impact the overall forecast.
The end result yielded a day-level forecast for each customer and a new version of that forecast created, and stored, every day. Building these models would not be easy but, as we’ll soon see, the team had an ace up their sleeve in leveraging Snowflake’s own product.
Cracking the Cold Start Problem
With the new framework in hand, Andrew set out gathering attributes to compare against Cold Start usage patterns. Within a few months, he stood up a working version in Python, and spent the next quarter testing how a mix of hundreds of technographic and firmographic attributes of new customers, correlated to the Cold Start usage patterns of legacy Snowflake customers.
In testing these attributes, the team faced some challenges common to many startups. Oftentimes, firmographic data is not easily standardized. As an example, how do you bucket Amazon into a single “industry vertical” or account for the “company size” of customers rapidly scaling their headcount?
Andrew found a way to work around these issues by focusing on more fixed variables like geography and the Sales segment a customer was sold by. These attributes also have the benefit of manual validation as Sales reps could review and update this data by hand in Snowflake’s CRM.
Shipping the First Iteration
With a working Cold Start model in place, Andrew started on the Hybrid and Consumption models.
The goal from the start was to transition to the Hybrid and Consumption models as quickly as possible based on the understanding that nailing usage at the customer level would create the most accurate forecast. Therefore, Andrew needed to determine the minimum amount of training data, or time, needed to move from the Cold Start to the Hybrid Model.
The answer would depend on the quality of the model’s training data, which came directly from Snowflake’s own customer base. However, the sheer amount of data needed to make this possible presented an issue. Generating a forecast every day across each individual customer, and hundreds of firmographic attributes, resulted in a cumulative dataset exceeding 2.5 billion records (and growing).
Fortunately, the team was able to tap into the power of Snowflake’s own product to manage this growing workload. By building on a platform that effectively has a near-infinite upper bound both in terms of computational power and data storage, Andrew could focus his time on building more predictive models. Storing the data in Snowflake also allowed the Finance team to easily create, and share, dashboards and reporting on the forecast throughout the company.
After a few months of building and testing the team rolled out their first iteration of the three models in December 2018. Through the benefit of backtesting, they identified the most optimal time intervals to leverage each model were Months 0-3 for the Cold Start, Months 3-12 for the Hybrid and beyond Month 12 for the Consumption model.
This approach brought the total Revenue forecast accuracy to a high single digit range, a dramatic improvement from the prior high teens baseline.
The IPO Goal Becomes Clear
A Change in Leadership
Shortly after the team unveiled their new forecasting approach, Snowflake’s leadership team underwent a transformation with Frank Slootman (CEO) and Mike Scarpelli (CFO) joining in April and August 2019 respectively. Their focus was clear: get Snowflake in a position where it could go public.
While preparation was required throughout the company, a significant dependency to an IPO was bringing Revenue forecast accuracy within +0-2%, and never under. This level of certainty as a requirement has been reiterated in Scarpelli’s own blog post, Scaling a Company to IPO and Beyond, where he’s quoted as saying, “if you don’t have predictability and you don’t have the ability to forecast, there’s only one answer: you’re not ready to go public.”
A New Level of Urgency
The leadership team’s mission placed a new level of urgency on Brad’s forecast accuracy initiative. Mike made it clear that it was Brad’s responsibility to prove he could deliver forecasts within the +0-2% goal as soon as possible. The executive team wouldn’t greenlight an IPO until Brad’s team delivered those results for two consecutive quarters.
Sprinting to the Finish Line
Refining the Hybrid & Consumption Model
The team would need more resources to help take things to the next level, so Brad hired their second Data Scientist, Matt Franking, in June 2019. Matt was tasked with getting the three models to consistently deliver forecast accuracy within the required IPO range.
While Snowflake would be judged externally based on the aggregate forecast results, Matt knew the secret to meaningful improvement required focusing on the customer level forecast.
Matt’s earliest win came from implementing a set of data quality rules to the training set, especially those that removed noise from one-off outlier events. This helped to systematically reduce the model’s sensitivity to anomalous trends.
Next, Matt focused on reworking the assumptions of the underlying models, taking advantage of two external factors in the process. First, Snowflake’s customer base had more than doubled since the original model’s release which yielded a more robust training set. Second, the company hired a separate team focused on data enrichment which helped make firmographic pattern matching more reliable.
Advancements from the above efforts also helped Matt optimize the aging intervals to deploy each model. The Cold Start model would be leveraged from Months 0-2, Hybrid model from Months 3-18 and the Consumption model beyond Month 18.
The combination of these efforts brought Snowflake’s Revenue forecast accuracy to a mid single digit range by December 2019.
Process Improvements to Close the Gap
Pressure was building to bring things to completion. They were closing in on their goal but each incremental improvement in forecast accuracy would require exponentially more effort. The team felt they’d gone as far as they could with the model. The key to getting over the last hurdle required deeper partnerships with teams outside of Finance.
Accounting provided a critical unlock in the process: helping the Finance team convert their customer level usage forecasts to GAAP Revenue. As Snowflake scaled, selling into larger and larger customers, so did the complexity of their contracts. Matt worked with Accounting to systematically reconcile how things like discounts and product vs. services Revenue recognition impacted Finance’s translation of usage forecasts into GAAP Revenue.
The team was missing important contextual details on Snowflake’s largest customers from boots on the ground sellers. To surface these insights, Matt set up regular check-ins with Sales leaders to align on customer-level discrepancies between the Sales Commit and Finance’s statistical model. Once the two teams aligned on a number, Matt tapped into the magic of Snowflake to instantly revise the forecast, upload the final number to the system and surface daily comparisons of forecast vs. actuals as results rolled in throughout the quarter.
Finally, Matt connected with Product to better understand how new features and functionality could influence future usage patterns that a statistical model couldn’t predict looking backwards.
This final push, rolled out in January 2020, got the team within the +0-2% range needed to clear the forecast accuracy dependency on the IPO.
The IPO and Beyond
The pressure on Brad’s team to meet their forecast accuracy goal was relentless leading up to a possible IPO, but their hard work validated as Snowflake went on to become one of the largest software IPOs in history in September 2020, raising $3.4 billion from an all star lineup of investors, including Warren Buffett’s Berkshire Hathaway, and ending their first day of trading with a market cap of $70 billion(2).
A Call to Action for Operators
As Brad looks back on this experience, a few lessons seem more true now than ever.
First, Finance and Operations teams will need to become more technical to stay relevant. The explosion of available data, and the need to take action on that information, will only increase over time. Assembling a team with expertise in SQL and data modeling will be a requirement to have a seat at the decision making table going forward.
Second, one of the most impactful outcomes of the forecast work was helping the team break the habit of reporting numbers retroactively. Most Finance and Operations teams claim to be stuck waiting for the quarter to close before they can run reporting and analysis, but the window to take action has closed by that point. Teams need to find ways to tap into real time insights and inform proactive decisions before it’s too late.
Finally, in addition to the technical capabilities of the team, having the right tech stack in place is critical in making this all come together. Brad’s team could not have succeeded without tapping into the capabilities of Snowflake’s own product. Your strategy around data and the technical acumen of your team can become a competitive advantage for companies everywhere. Revenue forecasting is just one example of how Snowflake’s Finance team uses its own product.
To learn more about Snowflake’s forecast transformation and how the product is leveraged internally to automate reporting and cost management, get in touch with Brad over email at Brad.Floering at Snowflake.com.

By Chris Burgner
Head of Finance & Analytics at Equals
